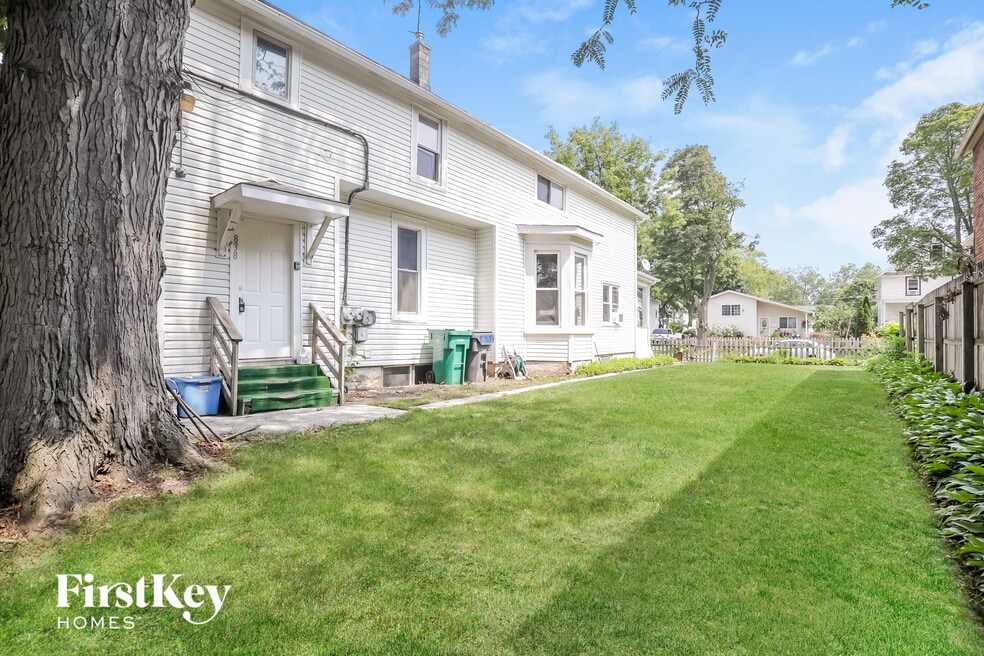
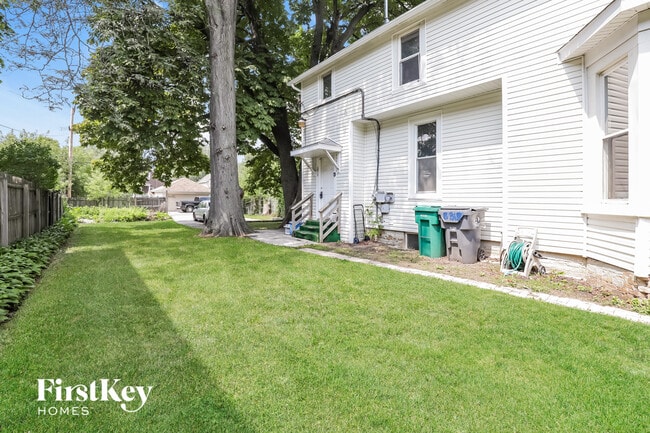
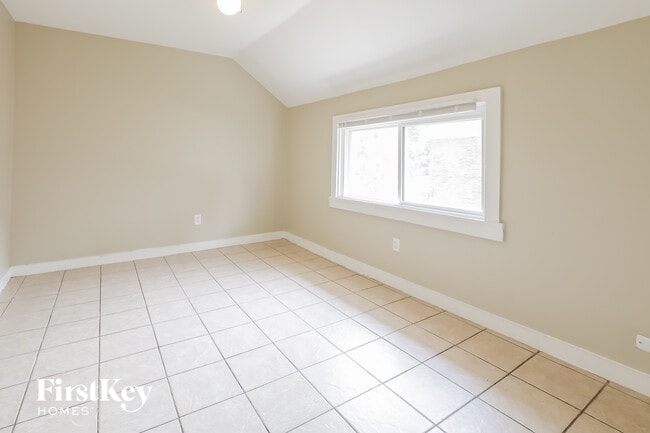
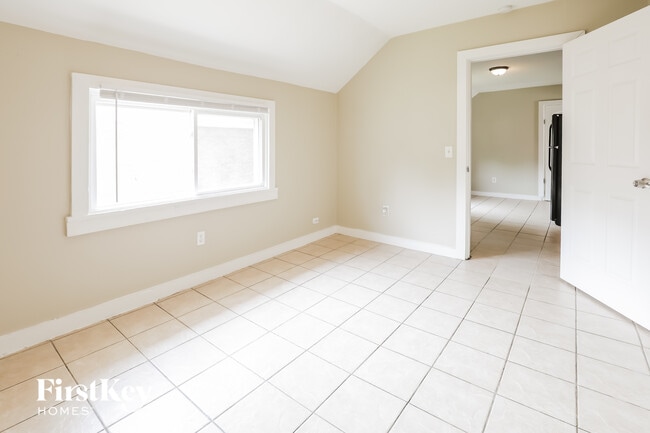
838 Prescott St Waukegan, IL 60085
About This Home
Please note that the advertised price may exclude additional fees. These include a mandatory $55 application fee per applicant; a one-time $75 admin fee; a $11 monthly utility management fee; fees for amenities like smart home or internet service; and optional conditional fees for services like self-guided tours with third-party provider Rently ($1.99 to $11.99), pet fees/rent, or pool maintenance, if applicable. HOA application and amenity fees, where applicable, are paid directly to the HOA. Get the home you want and the value you deserve with FirstKey Homes. Use our website to Apply Online, Schedule a Self-Tour, Review Resident Qualifications or Search More Homes; or contact our leasing department for help today. Pets are welcome. Apply soon, homes can go fast!
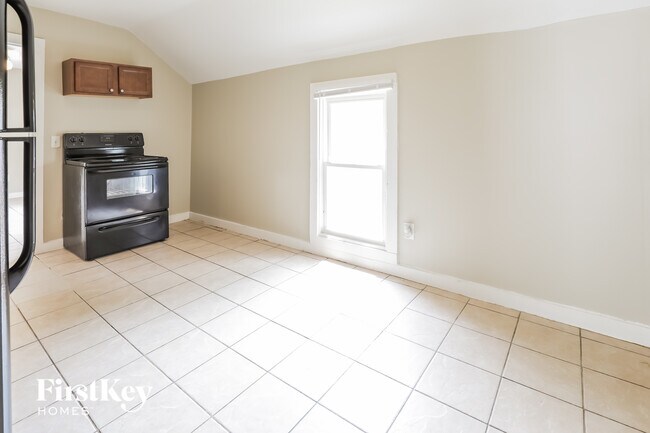
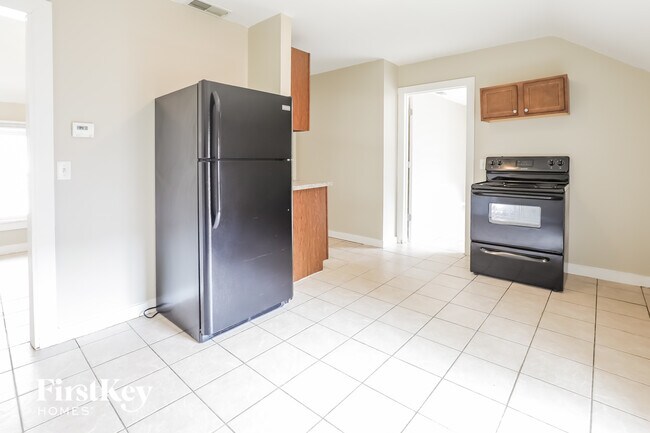
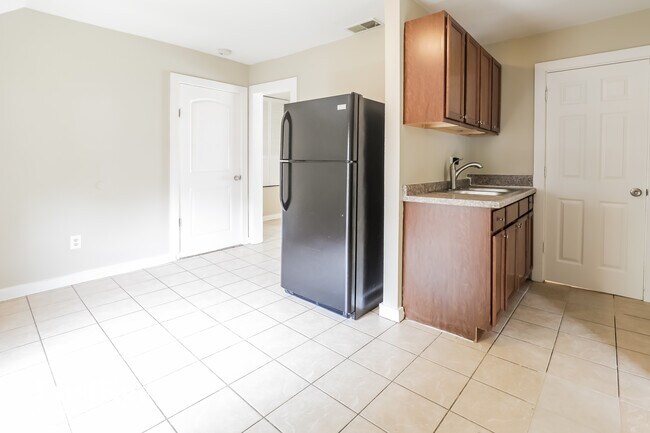
1 bedroom, 1 bathroom rental home in Waukegan, IL, may be just the home for you.
FirstKey Homes, LLC is an Equal Housing Lessor under the FHA. Applicable local, state and federal laws may apply. Lease terms and conditions apply. This is not an offer to rent—you must submit additional information for review and approval. Listed features may not be accurate; confirm details with a leasing representative. Certain cities and municipalities – including St. Louis and Chicago – require a home inspection prior to a new resident taking possession of the home. If you are leasing a home in one of these areas, please note that your move-in date could be adjusted to accommodate inspection requirements. Please ask your leasing agent for more details. BEWARE OF RENTAL SCAMS: FirstKey Homes exclusively manages our homes (no third-party management). We do not lease homes through Craigslist, SocialServe, LetGo, Facebook Marketplace or other classified advertising services. All applications and lease signing can only be completed through using the RentCafe portal. We will never ask for wire transfers, cash apps like Venmo, Zelle, CashApp PayPal, or any other transferring method to collect funds. See FirstKey Homes website for full details and conditions. Listing photos are provided to help you select a home; all photos shown are for representative and illustrative purposes only but may not be exact. Colors and photo size may vary based on different resolutions, hue, brightness, contrast, or other photo variations. Photos on websites may be modified, changed, or amended at any time. For new construction homes, actual homes may vary, photos may be of similar home/floorplan, home may be under construction and photos may not be of actual home, individual homes, amenities, features, and views may differ. If you have any concerns, please schedule a tour prior to applying or leasing the listed home.

Map
- 815 Prescott St
- 724 10th St
- 842 Wadsworth Ave
- 631 8th St
- 1101 Adams St
- 924 Lenox Ave
- 1102 Wadsworth Ave
- 710 S Martin Luther King Junior Ave
- 1210 Park Ave
- 600 Sunderlin St
- 720 13th St
- 515 George Ave
- 1244 Victoria Ave
- 1301 Park Ave
- 819 S Fulton Ave
- 446 S Jackson St
- 547 S Martin Luther King Junior Ave
- 1712 11th St
- 629 S Fulton Ave
- 1423 Victoria Ave
- 714 Helmholz Ave Unit 1
- 714 Helmholz Ave Unit 2
- 542 Oak St
- 1444 Hervey Ave
- 1217 16th St
- 1701 Victoria Ave
- 216 S Elmwood Ave
- 515 W Madison St
- 10 N Sheridan Rd
- 1915 Seymour Ave Unit 2
- 1604 20th St
- 1219 Broadway Ave
- 315 Julian St Unit 2
- 2318 Washington St Unit 1
- 25 Keller Ave Unit N
- 802 Grand Ave
- 802 Grand Ave
- 415 N Sheridan Rd
- 1003 Grand Ave Unit 2
- 623 Yeoman St