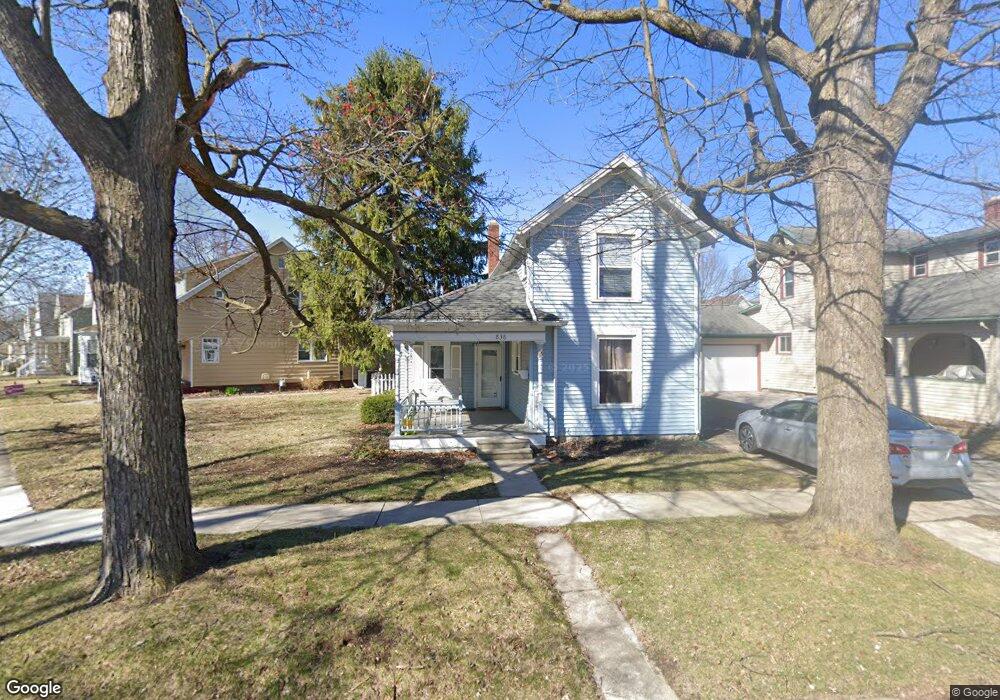
838 S Cory St Findlay, OH 45840
Estimated Value: $177,433 - $208,000
3
Beds
2
Baths
1,450
Sq Ft
$132/Sq Ft
Est. Value
About This Home
This home is located at 838 S Cory St, Findlay, OH 45840 and is currently estimated at $192,108, approximately $132 per square foot. 838 S Cory St is a home located in Hancock County with nearby schools including Lincoln Elementary School, Donnell Middle School, and Findlay High School.
Ownership History
Date
Name
Owned For
Owner Type
Purchase Details
Closed on
Jul 15, 2020
Sold by
Moyer Molly
Bought by
Schutz Amanda J and Toney Rasheem
Current Estimated Value
Home Financials for this Owner
Home Financials are based on the most recent Mortgage that was taken out on this home.
Original Mortgage
$134,345
Outstanding Balance
$119,128
Interest Rate
3.1%
Mortgage Type
New Conventional
Estimated Equity
$72,980
Purchase Details
Closed on
Sep 23, 2003
Sold by
Houk Tod M and Houk Elizabeth M
Bought by
Moyer Molly
Home Financials for this Owner
Home Financials are based on the most recent Mortgage that was taken out on this home.
Original Mortgage
$81,900
Interest Rate
6.33%
Mortgage Type
Unknown
Purchase Details
Closed on
Jun 1, 1998
Sold by
Rentz Kenyon
Bought by
Houk Tod
Home Financials for this Owner
Home Financials are based on the most recent Mortgage that was taken out on this home.
Original Mortgage
$65,550
Interest Rate
7.27%
Mortgage Type
New Conventional
Purchase Details
Closed on
Mar 13, 1990
Bought by
Rentz Kenyon J and Rentz Diane E
Purchase Details
Closed on
Jul 25, 1983
Bought by
Mann Brad C and Judy Pearl
Create a Home Valuation Report for This Property
The Home Valuation Report is an in-depth analysis detailing your home's value as well as a comparison with similar homes in the area
Home Values in the Area
Average Home Value in this Area
Purchase History
| Date | Buyer | Sale Price | Title Company |
|---|---|---|---|
| Schutz Amanda J | $138,500 | Golden Key Title Agency | |
| Moyer Molly | $91,000 | Heartland Title | |
| Houk Tod | $69,000 | -- | |
| Rentz Kenyon J | $55,500 | -- | |
| Mann Brad C | $37,000 | -- |
Source: Public Records
Mortgage History
| Date | Status | Borrower | Loan Amount |
|---|---|---|---|
| Open | Schutz Amanda J | $134,345 | |
| Closed | Moyer Molly | $81,900 | |
| Previous Owner | Houk Tod | $65,550 |
Source: Public Records
Tax History Compared to Growth
Tax History
| Year | Tax Paid | Tax Assessment Tax Assessment Total Assessment is a certain percentage of the fair market value that is determined by local assessors to be the total taxable value of land and additions on the property. | Land | Improvement |
|---|---|---|---|---|
| 2024 | $1,565 | $44,050 | $5,280 | $38,770 |
| 2023 | $1,567 | $44,050 | $5,280 | $38,770 |
| 2022 | $1,562 | $44,050 | $5,280 | $38,770 |
| 2021 | $1,522 | $37,400 | $5,420 | $31,980 |
| 2020 | $1,522 | $37,400 | $5,420 | $31,980 |
| 2019 | $1,491 | $37,400 | $5,420 | $31,980 |
| 2018 | $1,396 | $32,120 | $3,820 | $28,300 |
| 2017 | $1,397 | $32,120 | $3,820 | $28,300 |
| 2016 | $1,383 | $32,120 | $3,820 | $28,300 |
| 2015 | $809 | $18,500 | $3,820 | $14,680 |
| 2014 | $809 | $18,500 | $3,820 | $14,680 |
| 2012 | $816 | $18,500 | $3,820 | $14,680 |
Source: Public Records
Map
Nearby Homes