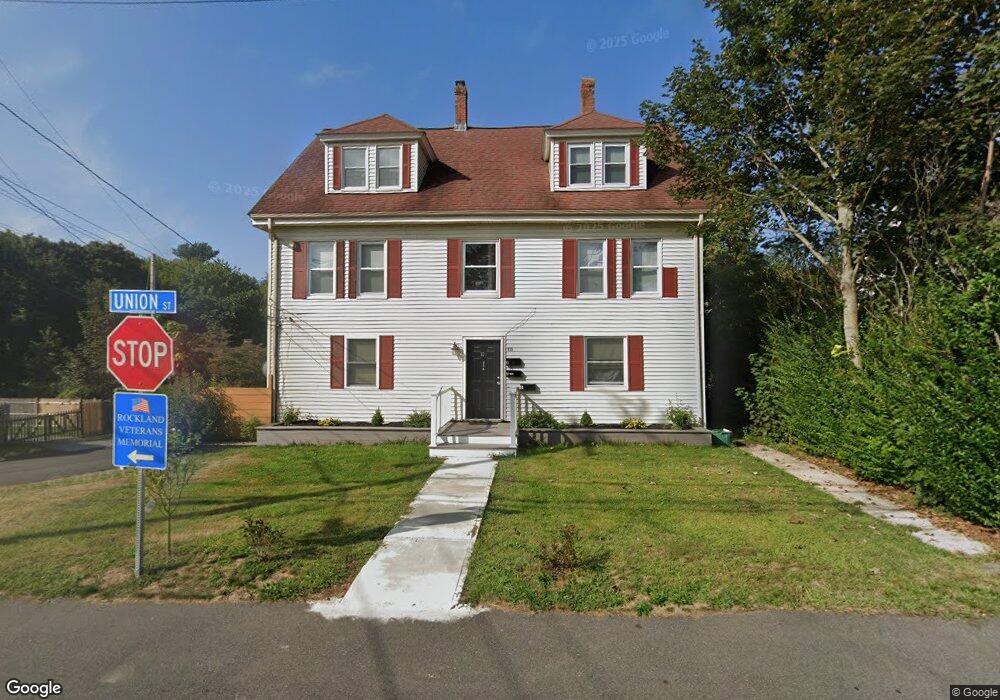
838 Union St Rockland, MA 02370
Estimated Value: $548,637 - $906,000
8
Beds
3
Baths
2,700
Sq Ft
$251/Sq Ft
Est. Value
About This Home
This home is located at 838 Union St, Rockland, MA 02370 and is currently estimated at $677,409, approximately $250 per square foot. 838 Union St is a home located in Plymouth County with nearby schools including Rockland Senior High School, Calvary Chapel Academy, and St Bridget School.
Ownership History
Date
Name
Owned For
Owner Type
Purchase Details
Closed on
Nov 1, 2013
Sold by
Caruso Mark P and Caruso Jeremy R
Bought by
Caruso Mark P
Current Estimated Value
Purchase Details
Closed on
Aug 17, 2010
Sold by
Cris Inv Llc
Bought by
Caruso Mark P and Caruso Jeremy R
Home Financials for this Owner
Home Financials are based on the most recent Mortgage that was taken out on this home.
Original Mortgage
$144,750
Interest Rate
4.63%
Mortgage Type
Purchase Money Mortgage
Purchase Details
Closed on
Mar 3, 2000
Sold by
Storella John P
Bought by
Wetzell Brett W
Home Financials for this Owner
Home Financials are based on the most recent Mortgage that was taken out on this home.
Original Mortgage
$215,100
Interest Rate
8.21%
Mortgage Type
Purchase Money Mortgage
Create a Home Valuation Report for This Property
The Home Valuation Report is an in-depth analysis detailing your home's value as well as a comparison with similar homes in the area
Home Values in the Area
Average Home Value in this Area
Purchase History
| Date | Buyer | Sale Price | Title Company |
|---|---|---|---|
| Caruso Mark P | -- | -- | |
| Caruso Mark P | $241,250 | -- | |
| Cris Inv Llc | $205,000 | -- | |
| Wetzell Brett W | $239,000 | -- |
Source: Public Records
Mortgage History
| Date | Status | Borrower | Loan Amount |
|---|---|---|---|
| Previous Owner | Caruso Mark P | $144,750 | |
| Previous Owner | Wetzell Brett W | $175,000 | |
| Previous Owner | Wetzell Brett W | $222,722 | |
| Previous Owner | Wetzell Brett W | $40,000 | |
| Previous Owner | Wetzell Brett W | $215,100 |
Source: Public Records
Tax History
| Year | Tax Paid | Tax Assessment Tax Assessment Total Assessment is a certain percentage of the fair market value that is determined by local assessors to be the total taxable value of land and additions on the property. | Land | Improvement |
|---|---|---|---|---|
| 2025 | $8,484 | $620,600 | $218,400 | $402,200 |
| 2024 | $8,236 | $585,800 | $206,100 | $379,700 |
| 2023 | $8,035 | $527,900 | $179,100 | $348,800 |
| 2022 | $7,544 | $450,400 | $155,700 | $294,700 |
| 2021 | $6,877 | $398,000 | $141,600 | $256,400 |
| 2020 | $6,634 | $379,100 | $134,800 | $244,300 |
| 2019 | $6,096 | $340,200 | $128,400 | $211,800 |
| 2018 | $5,794 | $318,000 | $128,400 | $189,600 |
| 2017 | $5,562 | $301,000 | $128,400 | $172,600 |
| 2016 | $5,357 | $289,700 | $123,500 | $166,200 |
| 2015 | $5,353 | $281,300 | $115,400 | $165,900 |
| 2014 | $5,060 | $275,900 | $113,200 | $162,700 |
Source: Public Records
Map
Nearby Homes
- 737-739 Union St
- 949 Union St
- 3 Leslie Ct
- 18 Boxberry Ln Unit 18
- 7 Boxberry Ln Unit 7
- 86 Leisurewoods Dr Unit 279
- 11 Hawthorne St
- 9 Juniper Cir
- 3 Hickory Cir
- 19 Dyer St Unit 19
- 48 Bigelow Ave
- 30 Leisurewoods Dr
- 1 Canterbury Ln
- 40 Fir Rd Unit 386
- 6 Chestnut Cir
- 17 Birch St Unit 135
- 9 Chestnut Cir
- 11 Chestnut Cir
- 1 Von Rhor Dr Unit 1
- 63 Webster St
Your Personal Tour Guide
Ask me questions while you tour the home.