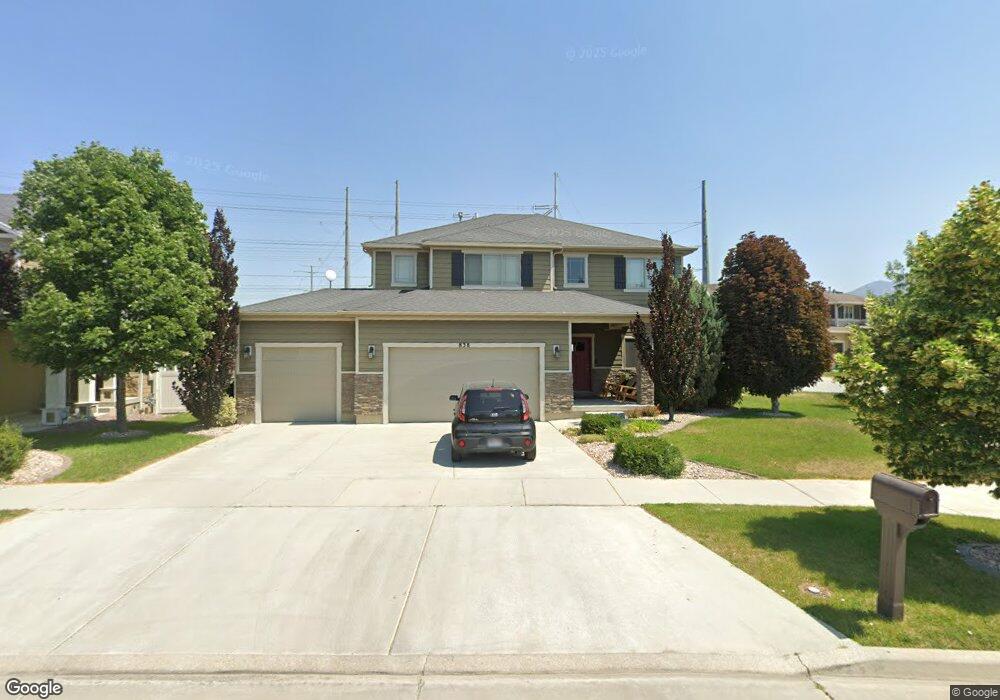
838 W Freedom Point Way Unit 128 Bluffdale, UT 84065
Estimated Value: $660,000 - $734,055
4
Beds
3
Baths
2,774
Sq Ft
$252/Sq Ft
Est. Value
About This Home
This home is located at 838 W Freedom Point Way Unit 128, Bluffdale, UT 84065 and is currently estimated at $697,764, approximately $251 per square foot. 838 W Freedom Point Way Unit 128 is a home located in Salt Lake County with nearby schools including Mountain Point Elementary School, Hidden Valley Middle School, and Riverton High School.
Ownership History
Date
Name
Owned For
Owner Type
Purchase Details
Closed on
Aug 21, 2024
Sold by
Liddiard Colter and Barney Elizabeth
Bought by
Mutual Investments Llc
Current Estimated Value
Purchase Details
Closed on
Nov 13, 2018
Sold by
Garcia Brooke B
Bought by
Liddiard Colter and Barney Elizabeth
Purchase Details
Closed on
Sep 14, 2018
Sold by
Garcia Gregory J and Garcia Brooke B
Bought by
Garcia Brooke B
Purchase Details
Closed on
Dec 15, 2014
Sold by
Alpine Homes Llc
Bought by
Garcia Greory J and Garcia Brooke B
Home Financials for this Owner
Home Financials are based on the most recent Mortgage that was taken out on this home.
Original Mortgage
$190,649
Interest Rate
3.95%
Mortgage Type
New Conventional
Create a Home Valuation Report for This Property
The Home Valuation Report is an in-depth analysis detailing your home's value as well as a comparison with similar homes in the area
Home Values in the Area
Average Home Value in this Area
Purchase History
| Date | Buyer | Sale Price | Title Company |
|---|---|---|---|
| Mutual Investments Llc | -- | Metro National Title | |
| Liddiard Colter | -- | Integrated Title Ins Service | |
| Garcia Brooke B | -- | Accommodation | |
| Garcia Greory J | -- | First American Title |
Source: Public Records
Mortgage History
| Date | Status | Borrower | Loan Amount |
|---|---|---|---|
| Previous Owner | Garcia Greory J | $190,649 |
Source: Public Records
Tax History Compared to Growth
Tax History
| Year | Tax Paid | Tax Assessment Tax Assessment Total Assessment is a certain percentage of the fair market value that is determined by local assessors to be the total taxable value of land and additions on the property. | Land | Improvement |
|---|---|---|---|---|
| 2025 | $3,066 | $689,900 | $283,400 | $406,500 |
| 2024 | $3,066 | $627,200 | $227,100 | $400,100 |
| 2023 | $3,212 | $586,300 | $192,800 | $393,500 |
| 2022 | $3,439 | $599,200 | $189,000 | $410,200 |
| 2021 | $2,796 | $454,800 | $162,900 | $291,900 |
| 2020 | $2,691 | $407,900 | $162,900 | $245,000 |
| 2019 | $2,650 | $394,000 | $162,900 | $231,100 |
| 2018 | $2,424 | $371,200 | $117,000 | $254,200 |
| 2017 | $2,376 | $348,000 | $117,000 | $231,000 |
| 2016 | $2,219 | $322,100 | $117,000 | $205,100 |
| 2015 | $2,275 | $321,600 | $137,700 | $183,900 |
| 2014 | $2,016 | $280,200 | $130,500 | $149,700 |
Source: Public Records
Map
Nearby Homes
- 15098 S Bright Stars Dr
- 951 W Cushing Rd
- 15144 S Bright Stars Dr
- 14877 S Brennan St
- 977 W Brennan St
- 1034 W Narrows Ln
- 15134 S White Hart Ln
- 15344 S Oriskany Ln
- 1097 W Coyote Gulch Way
- 1107 W Coyote Gulch Way
- 591 W Koins Way
- 15079 S Reins Way Unit 713
- 15091 S Reins Way
- 981 W Cyan Valley Way
- 15123 S Reins Way
- 15073 Halter Way
- 15436 S Navy Trails Ln
- 14984 S Wild Horse Way
- 1034 W Heritage Crest Way
- 15297 S Reins Way
- 838 W Freedom Point Way
- 842 W Freedom Point Way
- 826 W Star Spangled Dr
- 848 W Freedom Point Way
- 822 W Star Spangled Dr
- 825 W Star Spangled Dr
- 856 W Freedom Point Way
- 814 W Star Spangled Dr
- 815 W Star Spangled Dr
- 808 Star Spangled Dr
- 808 W Star Spangled Dr
- 809 W Star Spangled Dr
- 802 W Star Spangled Dr
- 802 W Star Spangled Dr
- 803 W Star Spangled Dr
- 876 W Freedom Point Way
- 794 W Star Spangled Dr
- 795 W Star Spangled Dr
- 14953 S Mckenna Rd Unit 327
- 867 W Mckenna Rd Unit 328