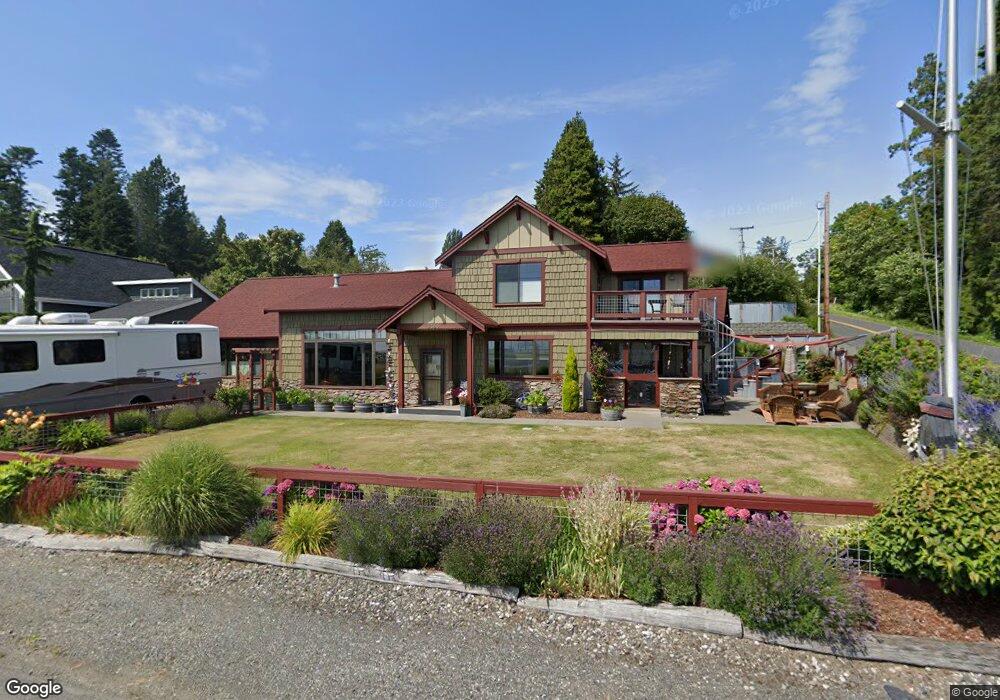
8380 Birch Bay Dr Blaine, WA 98230
Estimated Value: $1,134,523 - $1,460,000
3
Beds
5
Baths
2,761
Sq Ft
$455/Sq Ft
Est. Value
About This Home
This home is located at 8380 Birch Bay Dr, Blaine, WA 98230 and is currently estimated at $1,255,381, approximately $454 per square foot. 8380 Birch Bay Dr is a home located in Whatcom County with nearby schools including Blaine Primary School, Blaine Elementary School, and Blaine Middle School.
Ownership History
Date
Name
Owned For
Owner Type
Purchase Details
Closed on
Jan 29, 2009
Sold by
Ellis Douglas A and Ellis Barbara
Bought by
Ansell Bruce and Ansell Mary
Current Estimated Value
Home Financials for this Owner
Home Financials are based on the most recent Mortgage that was taken out on this home.
Original Mortgage
$417,000
Outstanding Balance
$262,747
Interest Rate
5.04%
Mortgage Type
Purchase Money Mortgage
Estimated Equity
$992,634
Purchase Details
Closed on
Oct 10, 2002
Sold by
Gardner William Gordon and Dayton Edward B
Bought by
Ellis Douglas A and Ellis Barbara
Home Financials for this Owner
Home Financials are based on the most recent Mortgage that was taken out on this home.
Original Mortgage
$100,000
Interest Rate
6.17%
Mortgage Type
Seller Take Back
Purchase Details
Closed on
Jul 12, 2001
Sold by
Hempler Nancy Anne
Bought by
Dayton Ida May and Gardner William Gordon
Create a Home Valuation Report for This Property
The Home Valuation Report is an in-depth analysis detailing your home's value as well as a comparison with similar homes in the area
Home Values in the Area
Average Home Value in this Area
Purchase History
| Date | Buyer | Sale Price | Title Company |
|---|---|---|---|
| Ansell Bruce | $625,280 | First American Title Ins | |
| Ellis Douglas A | -- | Whatcom Land Title | |
| Dayton Ida May | -- | -- |
Source: Public Records
Mortgage History
| Date | Status | Borrower | Loan Amount |
|---|---|---|---|
| Open | Ansell Bruce | $417,000 | |
| Previous Owner | Ellis Douglas A | $100,000 |
Source: Public Records
Tax History Compared to Growth
Tax History
| Year | Tax Paid | Tax Assessment Tax Assessment Total Assessment is a certain percentage of the fair market value that is determined by local assessors to be the total taxable value of land and additions on the property. | Land | Improvement |
|---|---|---|---|---|
| 2024 | $7,292 | $1,065,713 | $393,750 | $671,963 |
| 2023 | $7,292 | $1,065,713 | $393,750 | $671,963 |
| 2022 | $7,488 | $947,300 | $350,000 | $597,300 |
| 2021 | $7,118 | $832,103 | $245,040 | $587,063 |
| 2020 | $6,955 | $729,924 | $214,950 | $514,974 |
| 2019 | $6,335 | $686,985 | $202,305 | $484,680 |
| 2018 | $6,164 | $610,579 | $179,805 | $430,774 |
| 2017 | $5,251 | $535,346 | $157,650 | $377,696 |
| 2016 | $5,460 | $509,368 | $150,000 | $359,368 |
| 2015 | $5,319 | $510,968 | $152,055 | $358,913 |
| 2014 | -- | $485,843 | $145,590 | $340,253 |
| 2013 | -- | $480,548 | $144,000 | $336,548 |
Source: Public Records
Map
Nearby Homes
- 5279 Cherry Tree Ln
- 8339 Pheasant Dr
- 8320 Fawn Crescent
- 8297 Shintaffer Rd
- 8380 Grouse Crescent Dr
- 5228 Richmond Crescent
- 5177 Anderson Rd
- 5350 Nootka Loop
- 5409 Salish Rd
- 5382 Nootka Loop
- 5425 Salish Rd
- 5414 Lasiandra Dr
- 5411 Lonicera Dr
- 8458 Shintaffer Rd
- 5422 Lasiandra Dr
- 8165 Cowichan Rd
- 5423 Lonicera Dr
- 8293 Cowichan Rd
- 5486 Salish Rd
- 5502 Salish Rd
- 5263 Cherry Tree Ln
- 8388 Birch Bay Dr
- 8392 Birch Bay Dr
- 5275 Cherry Tree Ln
- 5275 Cherry Tree Ln
- 8293 Fawn Crescent
- 8360 Birch Bay Dr
- 8396 Birch Bay Dr
- 8295 Fawn Crescent
- 8356 Birch Bay Dr
- 8291 Fawn Crescent
- 8402 Birch Bay Dr
- 8352 Birch Bay Dr
- 8289 Fawn Crescent
- 8290 Fawn Crescent
- 8297 Fawn Crescent
- 8230 Deer Trail
- 5264 Cherry Tree Ln
- 5280 Cherry Tree Ln