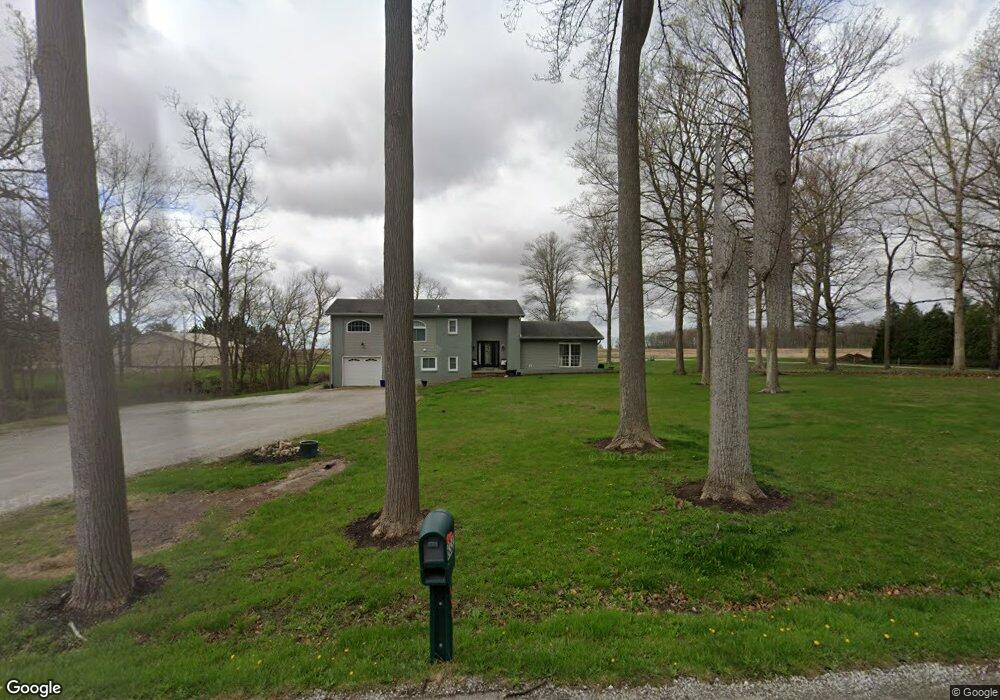
8383 W Delphi Pike Converse, IN 46919
Estimated Value: $255,720 - $314,000
5
Beds
3
Baths
2,280
Sq Ft
$123/Sq Ft
Est. Value
About This Home
This home is located at 8383 W Delphi Pike, Converse, IN 46919 and is currently estimated at $279,430, approximately $122 per square foot. 8383 W Delphi Pike is a home located in Grant County with nearby schools including Converse Elementary School, Sweetser Elementary School, and Oak Hill Junior High School.
Ownership History
Date
Name
Owned For
Owner Type
Purchase Details
Closed on
Apr 28, 2009
Sold by
The Bank Of New York Mellon Trust
Bought by
Ozmun John C and Ozmun Ruth D
Current Estimated Value
Purchase Details
Closed on
Dec 14, 2007
Sold by
Tedder Matthew A and Tedder Kristine A
Bought by
Bank Of New York Trust Co Na
Purchase Details
Closed on
Apr 23, 2003
Sold by
Not Provided
Bought by
Not Provided
Create a Home Valuation Report for This Property
The Home Valuation Report is an in-depth analysis detailing your home's value as well as a comparison with similar homes in the area
Purchase History
| Date | Buyer | Sale Price | Title Company |
|---|---|---|---|
| Ozmun John C | $32,000 | -- | |
| Ozmun John C | -- | None Available | |
| Bank Of New York Trust Co Na | $92,975 | None Available | |
| Not Provided | $85,000 | -- |
Source: Public Records
Tax History
| Year | Tax Paid | Tax Assessment Tax Assessment Total Assessment is a certain percentage of the fair market value that is determined by local assessors to be the total taxable value of land and additions on the property. | Land | Improvement |
|---|---|---|---|---|
| 2025 | $1,443 | $223,400 | $16,300 | $207,100 |
| 2024 | $1,443 | $206,600 | $16,300 | $190,300 |
| 2023 | $1,209 | $183,100 | $16,300 | $166,800 |
| 2022 | $1,253 | $159,700 | $15,100 | $144,600 |
| 2021 | $1,081 | $145,700 | $15,100 | $130,600 |
| 2020 | $985 | $141,600 | $15,100 | $126,500 |
| 2019 | $1,016 | $148,900 | $15,100 | $133,800 |
| 2018 | $873 | $143,600 | $13,800 | $129,800 |
| 2017 | $743 | $137,000 | $13,800 | $123,200 |
| 2016 | $662 | $130,500 | $13,800 | $116,700 |
| 2014 | $537 | $119,600 | $13,800 | $105,800 |
| 2013 | $537 | $127,200 | $13,800 | $113,400 |
Source: Public Records
Map
Nearby Homes
- 8431 W Delphi Pike
- 8360 W Delphi Pike
- 8453 W Delphi Pike
- 8392 W Delphi Pike
- 8448 W Delphi Pike
- 8318 W Delphi Pike
- 8473 W Delphi Pike
- 8281 W Delphi Pike Unit 27
- 8364 W Delphi Pike
- 8282 W Delphi Pike
- 8493 W Delphi Pike
- 8320 W Delphi Pike
- 8513 W Delphi Pike
- 8514 W Delphi Pike
- 8533 W Delphi Pike
- 8252 W Delphi Pike
- 8540 W Delphi Pike
- 8558 W Delphi Pike
- 8584 W Delphi Pike
- 8321 W Mier 27
Your Personal Tour Guide
Ask me questions while you tour the home.