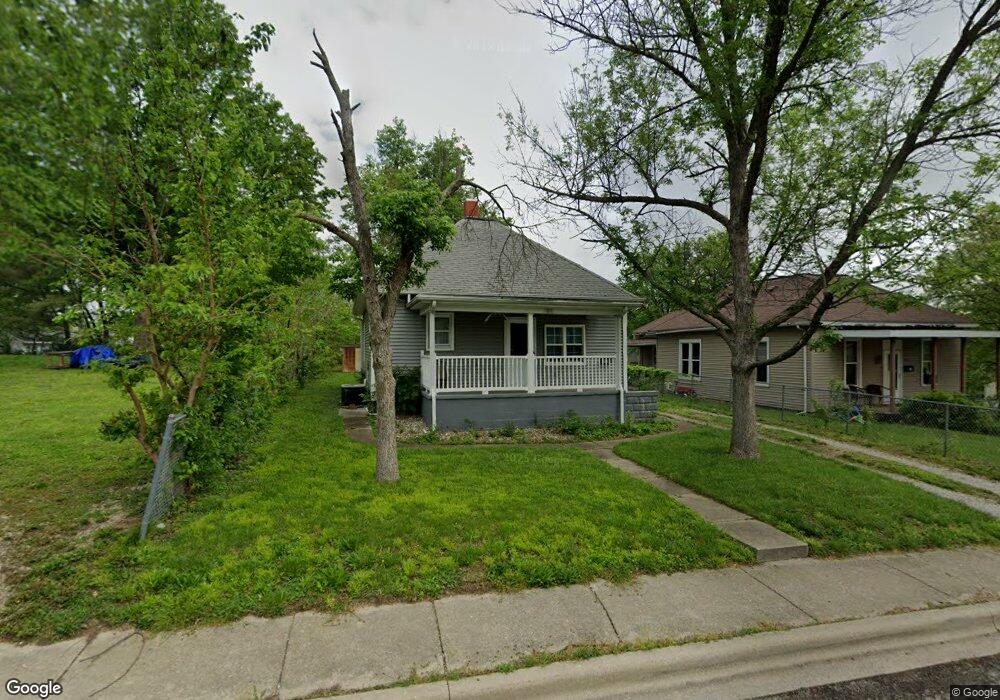
839 E Franklin St Taylorville, IL 62568
Estimated Value: $65,000 - $73,000
2
Beds
1
Bath
906
Sq Ft
$75/Sq Ft
Est. Value
About This Home
This home is located at 839 E Franklin St, Taylorville, IL 62568 and is currently estimated at $67,667, approximately $74 per square foot. 839 E Franklin St is a home located in Christian County with nearby schools including Memorial Elementary School, Taylorville Junior High School, and Taylorville Senior High School.
Ownership History
Date
Name
Owned For
Owner Type
Purchase Details
Closed on
Apr 9, 2011
Sold by
Marucco Anthony Michael and Marucco Michael C
Bought by
Peabody James Kevin and Peabody Sharon K
Current Estimated Value
Home Financials for this Owner
Home Financials are based on the most recent Mortgage that was taken out on this home.
Original Mortgage
$35,000
Outstanding Balance
$1,703
Interest Rate
3.25%
Mortgage Type
Future Advance Clause Open End Mortgage
Estimated Equity
$65,964
Purchase Details
Closed on
Apr 6, 2005
Sold by
Woolsey Dolores M and Last Will Of Jack Woolsey
Bought by
Marucco Michael C
Home Financials for this Owner
Home Financials are based on the most recent Mortgage that was taken out on this home.
Original Mortgage
$30,000
Interest Rate
6.5%
Mortgage Type
Adjustable Rate Mortgage/ARM
Create a Home Valuation Report for This Property
The Home Valuation Report is an in-depth analysis detailing your home's value as well as a comparison with similar homes in the area
Home Values in the Area
Average Home Value in this Area
Purchase History
| Date | Buyer | Sale Price | Title Company |
|---|---|---|---|
| Peabody James Kevin | $33,000 | None Available | |
| Marucco Michael C | $34,000 | None Available |
Source: Public Records
Mortgage History
| Date | Status | Borrower | Loan Amount |
|---|---|---|---|
| Open | Peabody James Kevin | $35,000 | |
| Previous Owner | Marucco Michael C | $30,000 |
Source: Public Records
Tax History Compared to Growth
Tax History
| Year | Tax Paid | Tax Assessment Tax Assessment Total Assessment is a certain percentage of the fair market value that is determined by local assessors to be the total taxable value of land and additions on the property. | Land | Improvement |
|---|---|---|---|---|
| 2024 | $869 | $16,952 | $2,539 | $14,413 |
| 2023 | $782 | $15,530 | $2,326 | $13,204 |
| 2022 | $722 | $14,422 | $2,160 | $12,262 |
| 2021 | $669 | $13,867 | $2,077 | $11,790 |
| 2020 | $685 | $14,107 | $2,115 | $11,992 |
| 2019 | $698 | $14,493 | $2,173 | $12,320 |
| 2018 | $659 | $13,891 | $2,083 | $11,808 |
| 2017 | $629 | $13,540 | $2,030 | $11,510 |
| 2016 | $543 | $13,192 | $1,976 | $11,216 |
| 2015 | $540 | $13,095 | $1,961 | $11,134 |
| 2014 | $986 | $12,820 | $1,920 | $10,900 |
| 2013 | $981 | $12,820 | $1,920 | $10,900 |
| 2011 | $8 | $10,106 | $1,883 | $8,223 |
Source: Public Records
Map
Nearby Homes
- 1010 E Adams St
- 507 E Market St
- 1221 E Park St
- 1017 E Ash St
- 221 E Adams St
- 306 E Poplar St
- 916 E Elm St
- 513 E Oak St
- 1015 E Elm St
- 117 S Pershing Ave
- 516 N Pawnee St
- 240 N Washington St
- 810 N Snodgrass St
- 525 S Washington St
- 1918 Greenview
- 822 S Clay St
- 412 W 1st St
- 536 W Main Cross St
- 629 W Adams St
- 910 E Heights Ave
- 901 E Franklin St
- 829 E Franklin St
- 911 E Franklin St
- 825 E Franklin St
- 908 E Market St
- 904 E Market St
- 836 E Franklin St
- 912 E Market St
- 832 E Franklin St
- 900 E Franklin St
- 920 E Market St
- 900 E Market St
- 809 E Franklin St
- 910 E Franklin St
- 824 E Market St
- 220 S Paw Paw St
- 820 E Franklin St
- 807 E Franklin St
- 212 S Paw St
- 816 E Franklin St