Warrenton Mill Condominiums 839 Main St Unit 10 Torrington, CT 06790
Estimated Value: $191,000 - $337,000
2
Beds
2
Baths
1,504
Sq Ft
$188/Sq Ft
Est. Value
About This Home
This home is located at 839 Main St Unit 10, Torrington, CT 06790 and is currently estimated at $282,589, approximately $187 per square foot. 839 Main St Unit 10 is a home located in Litchfield County with nearby schools including Torrington Middle School, Torrington High School, and St. John Paul the Great Academy.
Ownership History
Date
Name
Owned For
Owner Type
Purchase Details
Closed on
May 14, 2007
Sold by
Polci William P
Bought by
Reilly Michael F
Current Estimated Value
Home Financials for this Owner
Home Financials are based on the most recent Mortgage that was taken out on this home.
Original Mortgage
$116,850
Outstanding Balance
$70,414
Interest Rate
6%
Estimated Equity
$212,175
Purchase Details
Closed on
Oct 27, 2003
Sold by
Sweetman Jamie M and Gray Scott P
Bought by
Polci William P
Purchase Details
Closed on
Nov 22, 2002
Sold by
Correia Jennifer L
Bought by
Sweetman Gray Jaime M and Gray Scoot P
Purchase Details
Closed on
May 5, 2000
Sold by
Erwan Davon Spray T
Bought by
Correia Jennifer L
Purchase Details
Closed on
Dec 28, 1988
Sold by
Warrenton Mills
Bought by
Laura E Davon Spray Tr
Create a Home Valuation Report for This Property
The Home Valuation Report is an in-depth analysis detailing your home's value as well as a comparison with similar homes in the area
Home Values in the Area
Average Home Value in this Area
Purchase History
| Date | Buyer | Sale Price | Title Company |
|---|---|---|---|
| Reilly Michael F | $123,000 | -- | |
| Reilly Michael F | $123,000 | -- | |
| Polci William P | $86,000 | -- | |
| Polci William P | $86,000 | -- | |
| Sweetman Gray Jaime M | $70,000 | -- | |
| Sweetman Gray Jaime M | $70,000 | -- | |
| Correia Jennifer L | $14,966 | -- | |
| Correia Jennifer L | $29,934 | -- | |
| Correia Jennifer L | $14,966 | -- | |
| Laura E Davon Spray Tr | $128,900 | -- |
Source: Public Records
Mortgage History
| Date | Status | Borrower | Loan Amount |
|---|---|---|---|
| Open | Laura E Davon Spray Tr | $116,850 | |
| Closed | Laura E Davon Spray Tr | $116,850 |
Source: Public Records
Tax History Compared to Growth
Tax History
| Year | Tax Paid | Tax Assessment Tax Assessment Total Assessment is a certain percentage of the fair market value that is determined by local assessors to be the total taxable value of land and additions on the property. | Land | Improvement |
|---|---|---|---|---|
| 2025 | $6,659 | $173,180 | $0 | $173,180 |
| 2024 | $3,060 | $63,790 | $0 | $63,790 |
| 2023 | $3,059 | $63,790 | $0 | $63,790 |
| 2022 | $3,007 | $63,790 | $0 | $63,790 |
| 2021 | $2,945 | $63,790 | $0 | $63,790 |
| 2020 | $2,945 | $63,790 | $0 | $63,790 |
| 2019 | $3,424 | $74,150 | $0 | $74,150 |
| 2018 | $3,424 | $74,150 | $0 | $74,150 |
| 2017 | $3,392 | $74,150 | $0 | $74,150 |
| 2016 | $3,392 | $74,150 | $0 | $74,150 |
| 2015 | $3,392 | $74,150 | $0 | $74,150 |
| 2014 | $3,795 | $104,490 | $0 | $104,490 |
Source: Public Records
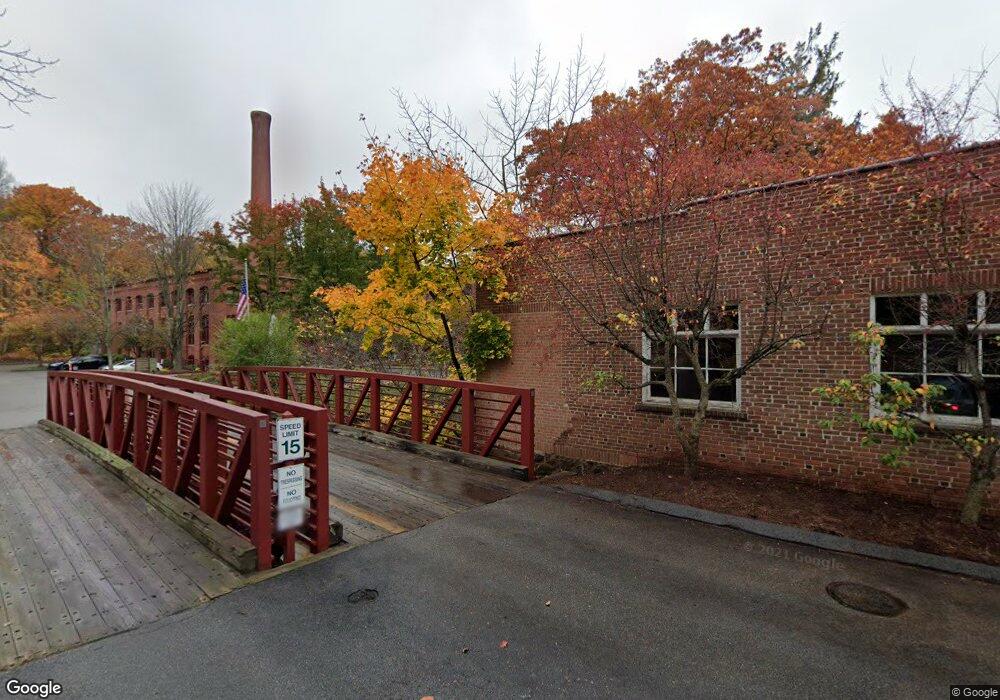
About Warrenton Mill Condominiums
Map
Nearby Homes
- 839 Main St Unit 65
- 839 Main St Unit 12
- 839 Main St Unit 91
- 839 Main St Unit 104
- 908 Main St
- 18 Tarlton St
- 775 Main St
- 25 Margerie St
- 0 Stoneridge Dr
- 168 Newfield Rd
- 115 Margerie St
- 118 Bannon St
- 483 Brightwood Ave
- 148 Lois St
- 38 Surrey Ln Unit 38
- 130 N Elm St
- 3 Surrey Ln Unit L3
- 69 McGuinness St
- 27 Surrey Ln Unit d27
- 90 Spruce Dr
- 839 Main St Unit 88
- 839 Main St Unit 114
- 839 Main St Unit 86
- 839 Main St Unit 41
- 839 Main St Unit 112
- 839 Main St Unit 100
- 839 Main St Unit 64
- 839 Main St Unit 113
- 839 Main St Unit 25
- 839 Main St Unit 75
- 839 Main St Unit 82
- 839 Main St Unit 102
- 839 Main St Unit 47
- 839 Main St Unit 54
- 839 Main St Unit 51
- 839 Main St Unit 52
- 839 Main St Unit 116
- 839 Main St Unit 67
- 839 Main St Unit 27
- 839 Main St Unit 95