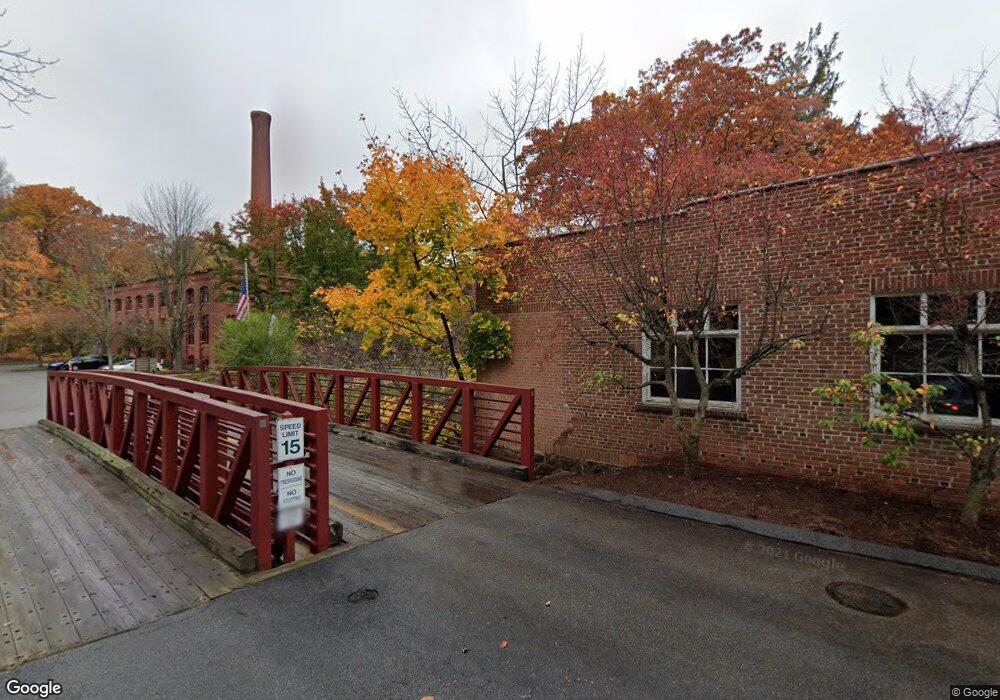
Warrenton Mill Condominiums 839 Main St Unit 86 Torrington, CT 06790
Estimated Value: $160,000 - $255,000
1
Bed
2
Baths
800
Sq Ft
$253/Sq Ft
Est. Value
About This Home
This home is located at 839 Main St Unit 86, Torrington, CT 06790 and is currently estimated at $202,543, approximately $253 per square foot. 839 Main St Unit 86 is a home located in Litchfield County with nearby schools including Torrington Middle School, Torrington High School, and St. John Paul the Great Academy.
Ownership History
Date
Name
Owned For
Owner Type
Purchase Details
Closed on
Apr 9, 2009
Sold by
Secombe Anthony D
Bought by
Przygocki Jason B
Current Estimated Value
Home Financials for this Owner
Home Financials are based on the most recent Mortgage that was taken out on this home.
Original Mortgage
$93,279
Interest Rate
4.94%
Purchase Details
Closed on
May 30, 2006
Sold by
Shift 4 Holdings Llc
Bought by
Secombe Anthony D
Home Financials for this Owner
Home Financials are based on the most recent Mortgage that was taken out on this home.
Original Mortgage
$94,500
Interest Rate
7.95%
Purchase Details
Closed on
Apr 4, 2006
Sold by
Katz Joel M
Bought by
Shift 4 Holdings Llc
Home Financials for this Owner
Home Financials are based on the most recent Mortgage that was taken out on this home.
Original Mortgage
$94,500
Interest Rate
7.95%
Purchase Details
Closed on
Dec 29, 1987
Sold by
Warrenton Mill Asso
Bought by
Scullin James J
Create a Home Valuation Report for This Property
The Home Valuation Report is an in-depth analysis detailing your home's value as well as a comparison with similar homes in the area
Home Values in the Area
Average Home Value in this Area
Purchase History
| Date | Buyer | Sale Price | Title Company |
|---|---|---|---|
| Przygocki Jason B | $95,000 | -- | |
| Secombe Anthony D | $105,000 | -- | |
| Shift 4 Holdings Llc | $65,000 | -- | |
| Scullin James J | $106,900 | -- |
Source: Public Records
Mortgage History
| Date | Status | Borrower | Loan Amount |
|---|---|---|---|
| Open | Scullin James J | $88,800 | |
| Closed | Scullin James J | $93,279 | |
| Previous Owner | Scullin James J | $94,500 | |
| Previous Owner | Scullin James J | $70,000 |
Source: Public Records
Tax History Compared to Growth
Tax History
| Year | Tax Paid | Tax Assessment Tax Assessment Total Assessment is a certain percentage of the fair market value that is determined by local assessors to be the total taxable value of land and additions on the property. | Land | Improvement |
|---|---|---|---|---|
| 2025 | $4,726 | $122,920 | $0 | $122,920 |
| 2024 | $1,887 | $39,330 | $0 | $39,330 |
| 2023 | $1,886 | $39,330 | $0 | $39,330 |
| 2022 | $1,854 | $39,330 | $0 | $39,330 |
| 2021 | $1,816 | $39,330 | $0 | $39,330 |
| 2020 | $1,816 | $39,330 | $0 | $39,330 |
| 2019 | $2,297 | $49,760 | $0 | $49,760 |
| 2018 | $2,297 | $49,760 | $0 | $49,760 |
| 2017 | $2,277 | $49,760 | $0 | $49,760 |
| 2016 | $2,277 | $49,760 | $0 | $49,760 |
| 2015 | $2,277 | $49,760 | $0 | $49,760 |
| 2014 | $2,553 | $70,290 | $0 | $70,290 |
Source: Public Records
About Warrenton Mill Condominiums
Map
Nearby Homes
- 839 Main St Unit 65
- 839 Main St Unit 12
- 839 Main St Unit 91
- 839 Main St Unit 104
- 908 Main St
- 18 Tarlton St
- 775 Main St
- 25 Margerie St
- 0 Stoneridge Dr
- 168 Newfield Rd
- 115 Margerie St
- 118 Bannon St
- 483 Brightwood Ave
- 148 Lois St
- 38 Surrey Ln Unit 38
- 130 N Elm St
- 3 Surrey Ln Unit L3
- 69 McGuinness St
- 27 Surrey Ln Unit d27
- 90 Spruce Dr
- 839 Main St Unit 88
- 839 Main St Unit 114
- 839 Main St Unit 41
- 839 Main St Unit 112
- 839 Main St Unit 100
- 839 Main St Unit 64
- 839 Main St Unit 113
- 839 Main St Unit 25
- 839 Main St Unit 75
- 839 Main St Unit 82
- 839 Main St Unit 102
- 839 Main St Unit 47
- 839 Main St Unit 54
- 839 Main St Unit 10
- 839 Main St Unit 51
- 839 Main St Unit 52
- 839 Main St Unit 116
- 839 Main St Unit 67
- 839 Main St Unit 27
- 839 Main St Unit 95