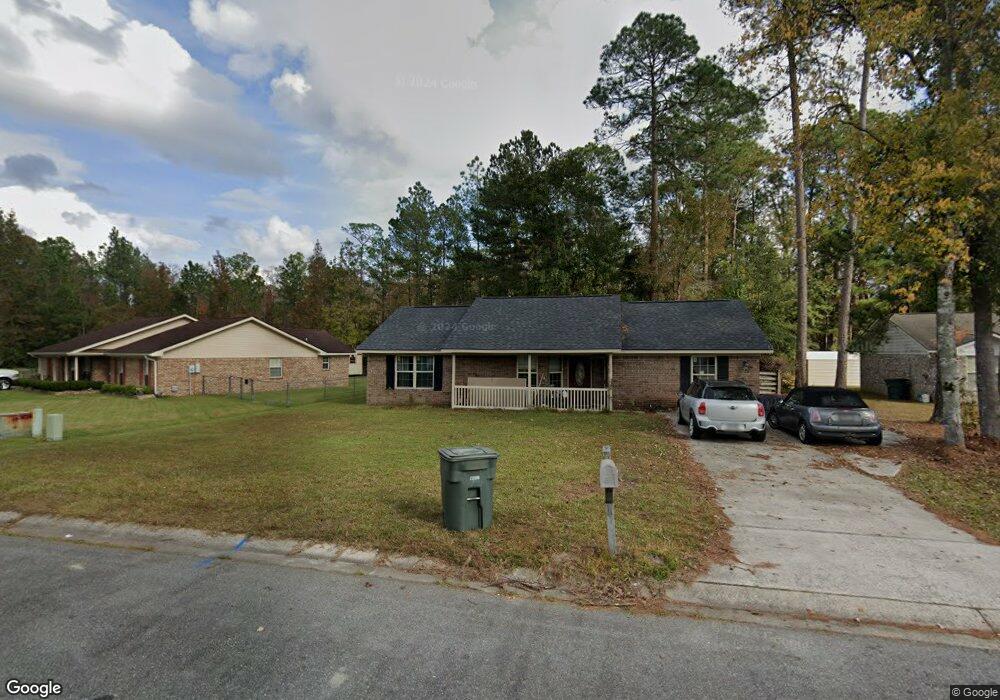
839 N Brickyard Rd Hinesville, GA 31313
Estimated Value: $206,000 - $230,000
3
Beds
2
Baths
1,453
Sq Ft
$150/Sq Ft
Est. Value
About This Home
This home is located at 839 N Brickyard Rd, Hinesville, GA 31313 and is currently estimated at $218,064, approximately $150 per square foot. 839 N Brickyard Rd is a home located in Liberty County with nearby schools including Frank Long Elementary School, Lewis Frasier Middle School, and Liberty County High School.
Ownership History
Date
Name
Owned For
Owner Type
Purchase Details
Closed on
May 14, 2004
Sold by
Lineberger Jennifer and Lineberger Jesse
Bought by
Garcia Allison M
Current Estimated Value
Purchase Details
Closed on
Oct 29, 2001
Sold by
Chadwick Joe C and Chadwick Ter
Bought by
Chadwick Joe C and Chadwick Teresa
Purchase Details
Closed on
Mar 1, 2001
Sold by
Chadwick Joe C and Chadwick Teresa
Bought by
Green Tree Financial Servicing Corp
Purchase Details
Closed on
Aug 28, 1998
Sold by
Sec Of Va
Bought by
Chadwick Joe C and Chadwick Ter
Purchase Details
Closed on
Jan 6, 1998
Sold by
Pnc Mtg Corp
Bought by
Sec Of Va
Purchase Details
Closed on
Dec 22, 1994
Sold by
Rowe Joseph
Bought by
Butler Carla-Michell
Purchase Details
Closed on
Jun 6, 1994
Bought by
Rowe Joseph
Create a Home Valuation Report for This Property
The Home Valuation Report is an in-depth analysis detailing your home's value as well as a comparison with similar homes in the area
Home Values in the Area
Average Home Value in this Area
Purchase History
| Date | Buyer | Sale Price | Title Company |
|---|---|---|---|
| Garcia Allison M | $79,700 | -- | |
| Chadwick Joe C | $57,900 | -- | |
| Green Tree Financial Servicing Corp | -- | -- | |
| Chadwick Joe C | $69,000 | -- | |
| Sec Of Va | -- | -- | |
| Pnc Mtg Corp | $66,300 | -- | |
| Butler Carla-Michell | $65,100 | -- | |
| Rowe Joseph | $12,000 | -- |
Source: Public Records
Tax History Compared to Growth
Tax History
| Year | Tax Paid | Tax Assessment Tax Assessment Total Assessment is a certain percentage of the fair market value that is determined by local assessors to be the total taxable value of land and additions on the property. | Land | Improvement |
|---|---|---|---|---|
| 2024 | $3,168 | $68,390 | $12,000 | $56,390 |
| 2023 | $3,168 | $64,358 | $12,000 | $52,358 |
| 2022 | $2,067 | $48,159 | $10,000 | $38,159 |
| 2021 | $1,891 | $43,603 | $10,000 | $33,603 |
| 2020 | $1,708 | $39,401 | $10,000 | $29,401 |
| 2019 | $1,713 | $39,779 | $10,000 | $29,779 |
| 2018 | $1,723 | $40,158 | $10,000 | $30,158 |
| 2017 | $1,335 | $40,536 | $10,000 | $30,536 |
| 2016 | $1,680 | $40,914 | $10,000 | $30,914 |
| 2015 | $1,820 | $40,914 | $10,000 | $30,914 |
| 2014 | $1,820 | $43,570 | $9,200 | $34,370 |
| 2013 | -- | $43,376 | $9,200 | $34,176 |
Source: Public Records
Map
Nearby Homes
- 332 Mortar Place
- 810 Hod Ln
- 806 Hod Ln
- 706 Dover Ln
- 314 York Ln
- 718 Dover Ln
- 718 Dove Ln
- 1316 Hill View Cir
- 330 Wexford Dr
- 1232 Peacock Trail
- 76 Boundary Hal Way
- 412 Timberlane Cir
- 614 S Main St
- 1109 Sara Ln
- 818 W Oglethorpe Hwy
- 408 Flowers Dr
- 411 Christopher Dr
- 407 Simpson St
- 929 Oak Crest Dr
- 14.27+/- Oglethorpe Hwy
- 839 Brickyard Rd
- 837 N Brickyard Rd
- 837 Brickyard Rd
- 841 Brickyard Rd
- 835 Brickyard Rd
- 835 N Brickyard Rd
- 843 Brickyard Rd
- 836 N Brickyard Rd
- 843 N Brickyard Rd
- 836 Brickyard Rd
- 834 Brickyard Rd
- 334 Nottingham Way
- 838 Brickyard Rd
- 833 N Brickyard Rd
- 840 Brickyard Rd
- 842 Brickyard Rd
- 833 Brickyard Rd
- 333 Mortar Place
- 332 Nottingham Way
- 831 Brickyard Rd