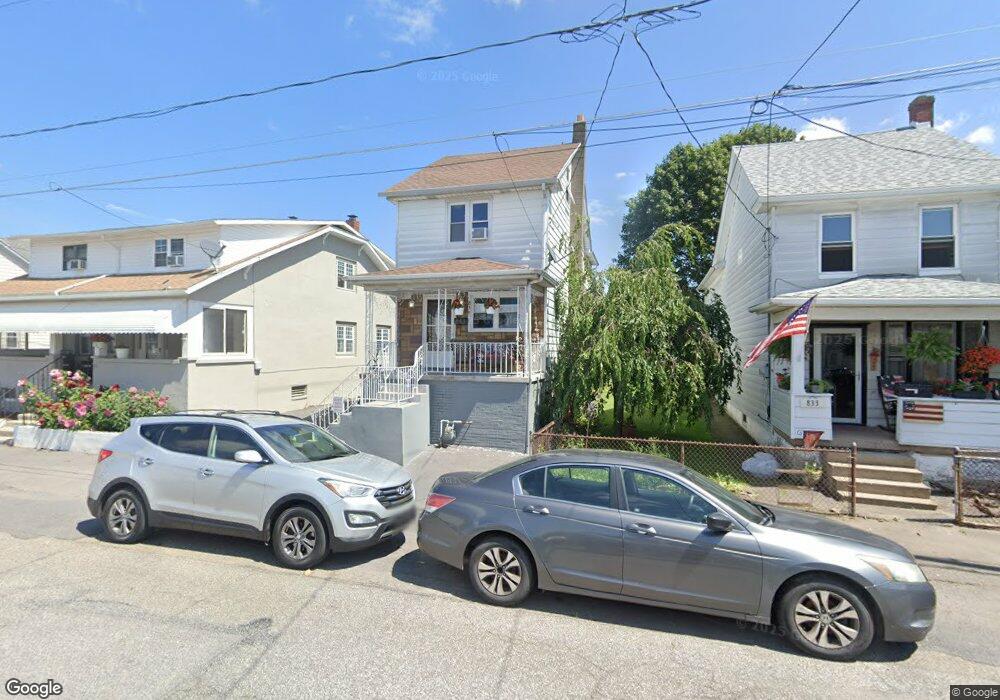
839 N James St Hazleton, PA 18201
Estimated Value: $145,849 - $221,000
--
Bed
--
Bath
1,064
Sq Ft
$171/Sq Ft
Est. Value
About This Home
This home is located at 839 N James St, Hazleton, PA 18201 and is currently estimated at $181,462, approximately $170 per square foot. 839 N James St is a home located in Luzerne County with nearby schools including Hazleton Area High School, Immanuel Christian School, and Holy Family Academy.
Ownership History
Date
Name
Owned For
Owner Type
Purchase Details
Closed on
Oct 5, 2018
Sold by
Marnell Antojnette G and Estate Of Ann G Koslop
Bought by
Fernandez Beatrtz E Duran De
Current Estimated Value
Home Financials for this Owner
Home Financials are based on the most recent Mortgage that was taken out on this home.
Original Mortgage
$76,000
Outstanding Balance
$66,277
Interest Rate
4.5%
Mortgage Type
New Conventional
Estimated Equity
$115,185
Purchase Details
Closed on
Sep 24, 2004
Bought by
Marnell Antoinette G
Create a Home Valuation Report for This Property
The Home Valuation Report is an in-depth analysis detailing your home's value as well as a comparison with similar homes in the area
Home Values in the Area
Average Home Value in this Area
Purchase History
| Date | Buyer | Sale Price | Title Company |
|---|---|---|---|
| Fernandez Beatrtz E Duran De | $80,000 | Fox Ridge Abstract | |
| Marnell Antoinette G | -- | -- |
Source: Public Records
Mortgage History
| Date | Status | Borrower | Loan Amount |
|---|---|---|---|
| Open | Fernandez Beatrtz E Duran De | $76,000 |
Source: Public Records
Tax History Compared to Growth
Tax History
| Year | Tax Paid | Tax Assessment Tax Assessment Total Assessment is a certain percentage of the fair market value that is determined by local assessors to be the total taxable value of land and additions on the property. | Land | Improvement |
|---|---|---|---|---|
| 2025 | $1,675 | $58,300 | $22,800 | $35,500 |
| 2024 | $1,569 | $58,300 | $22,800 | $35,500 |
| 2023 | $1,467 | $58,300 | $22,800 | $35,500 |
| 2022 | $1,456 | $58,300 | $22,800 | $35,500 |
| 2021 | $1,422 | $58,300 | $22,800 | $35,500 |
| 2020 | $1,271 | $58,300 | $22,800 | $35,500 |
| 2019 | $1,311 | $58,300 | $22,800 | $35,500 |
| 2018 | $1,267 | $58,300 | $22,800 | $35,500 |
| 2017 | $1,168 | $58,300 | $22,800 | $35,500 |
| 2016 | $445 | $58,300 | $22,800 | $35,500 |
| 2015 | $412 | $58,300 | $22,800 | $35,500 |
| 2014 | $412 | $58,300 | $22,800 | $35,500 |
Source: Public Records
Map
Nearby Homes
- 782 N James St
- 882 N Locust St
- 756 Peace St
- 714 Alter St
- 827 N Vine St
- 1009 Peace St
- 739 N Church St
- 837 N Laurel St
- 19 W 14th St
- 738 N Manhattan Ct
- 572 N Vine St
- 1087 N Rear Locust St
- 667 Roosevelt St
- 522 N James St
- 590 Mckinley St
- 60 E Jefferson Ave
- 425 Anchor St
- 14 W 5th St
- 530 N Lee Ct
- 756 Seybert St
- 841 N James St
- 833 N James St
- 843 N James St
- 833 Penn Ct
- 825 N James St
- 845 N James St
- 821 N James St
- 817 N James St
- 844 N Locust St
- 853 N James St
- 838 N James St
- 850 N James St
- 852 N James St
- 830 N James St
- 838 N Locust St
- 863 N Morgan St
- 854 N James St
- 818 N James St
- 846 N Locust St
- 858 N James St