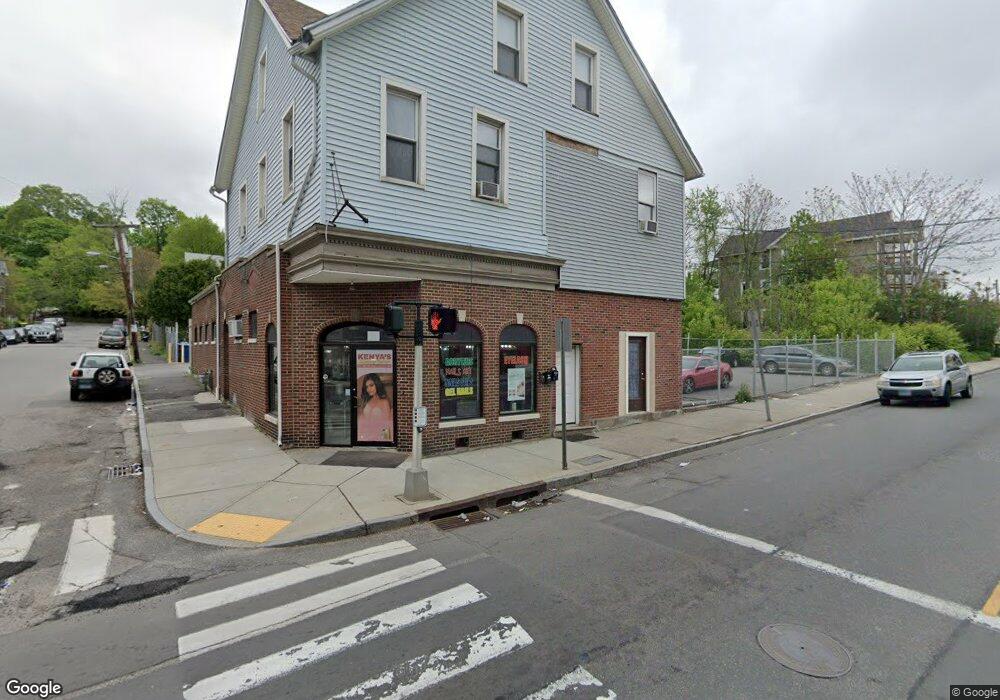
839 N Main St Waterbury, CT 06704
North End District NeighborhoodEstimated Value: $196,637
--
Bed
1
Bath
5,467
Sq Ft
$36/Sq Ft
Est. Value
About This Home
This home is located at 839 N Main St, Waterbury, CT 06704 and is currently estimated at $196,637, approximately $35 per square foot. 839 N Main St is a home located in New Haven County with nearby schools including Wilby High School, Alpha & Omega Christian Academy, and Mesivta Ateres Shmuel of Waterbury.
Ownership History
Date
Name
Owned For
Owner Type
Purchase Details
Closed on
Apr 7, 2016
Sold by
839 North Main Street
Bought by
Chabla Luis
Current Estimated Value
Purchase Details
Closed on
Aug 2, 2010
Sold by
Kinig Harry L
Bought by
839 North Main Street
Purchase Details
Closed on
Jun 28, 2010
Sold by
Sunrise Rehab Loans Ll
Bought by
King Harry
Purchase Details
Closed on
Sep 3, 2008
Sold by
Jp Morgan Chase Bank N
Bought by
Grasser Cecilio
Home Financials for this Owner
Home Financials are based on the most recent Mortgage that was taken out on this home.
Original Mortgage
$114,700
Interest Rate
6.69%
Mortgage Type
Commercial
Purchase Details
Closed on
Dec 12, 2006
Sold by
Griffin Stephen R
Bought by
Jp Morgan Chase Bk
Create a Home Valuation Report for This Property
The Home Valuation Report is an in-depth analysis detailing your home's value as well as a comparison with similar homes in the area
Home Values in the Area
Average Home Value in this Area
Purchase History
| Date | Buyer | Sale Price | Title Company |
|---|---|---|---|
| Chabla Luis | $100,000 | -- | |
| 839 North Main Street | -- | -- | |
| King Harry | -- | -- | |
| Grasser Cecilio | $84,000 | -- | |
| Jp Morgan Chase Bk | $170,115 | -- |
Source: Public Records
Mortgage History
| Date | Status | Borrower | Loan Amount |
|---|---|---|---|
| Previous Owner | Jp Morgan Chase Bk | $114,700 | |
| Previous Owner | Jp Morgan Chase Bk | $50,000 |
Source: Public Records
Tax History Compared to Growth
Tax History
| Year | Tax Paid | Tax Assessment Tax Assessment Total Assessment is a certain percentage of the fair market value that is determined by local assessors to be the total taxable value of land and additions on the property. | Land | Improvement |
|---|---|---|---|---|
| 2025 | $11,483 | $255,290 | $18,340 | $236,950 |
| 2024 | $12,622 | $255,290 | $18,340 | $236,950 |
| 2023 | $13,834 | $255,290 | $18,340 | $236,950 |
| 2022 | $5,042 | $83,740 | $18,380 | $65,360 |
| 2021 | $5,042 | $83,740 | $18,380 | $65,360 |
| 2020 | $5,042 | $83,740 | $18,380 | $65,360 |
| 2019 | $5,042 | $83,740 | $18,380 | $65,360 |
| 2018 | $5,042 | $83,740 | $18,380 | $65,360 |
| 2017 | $6,908 | $114,740 | $18,380 | $96,360 |
| 2016 | $6,908 | $114,740 | $18,380 | $96,360 |
| 2015 | $6,680 | $114,740 | $18,380 | $96,360 |
| 2014 | $6,680 | $114,740 | $18,380 | $96,360 |
Source: Public Records
Map
Nearby Homes