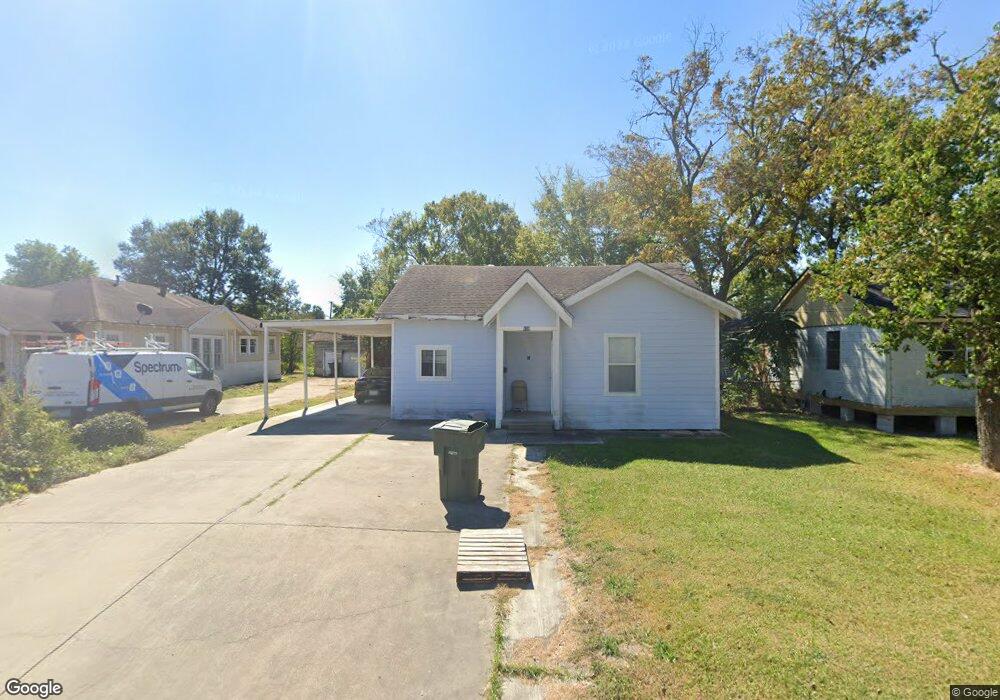
839 Neches Ave Port Arthur, TX 77642
Estimated Value: $70,439 - $100,000
--
Bed
--
Bath
1,172
Sq Ft
$70/Sq Ft
Est. Value
About This Home
This home is located at 839 Neches Ave, Port Arthur, TX 77642 and is currently estimated at $81,860, approximately $69 per square foot. 839 Neches Ave is a home located in Jefferson County with nearby schools including Lakeview Elementary School, Jefferson Middle School, and Memorial High School.
Ownership History
Date
Name
Owned For
Owner Type
Purchase Details
Closed on
Jul 9, 2012
Sold by
Le Tai Phat
Bought by
Vanhuynh Trung
Current Estimated Value
Purchase Details
Closed on
Mar 27, 2009
Sold by
Truong Anthony
Bought by
Le Tai Phat
Purchase Details
Closed on
Dec 1, 2008
Sold by
Nguyen Huong Thi
Bought by
Truong Anthony
Purchase Details
Closed on
Oct 15, 2008
Sold by
Le Tai Phat
Bought by
Nguyen Huong Thi
Purchase Details
Closed on
Aug 20, 2007
Sold by
Nunez Francisco Pulido
Bought by
Le Tai Phat
Purchase Details
Closed on
Jan 23, 2004
Sold by
Ceja Salvador
Bought by
Nunez Francisco Pulido
Create a Home Valuation Report for This Property
The Home Valuation Report is an in-depth analysis detailing your home's value as well as a comparison with similar homes in the area
Home Values in the Area
Average Home Value in this Area
Purchase History
| Date | Buyer | Sale Price | Title Company |
|---|---|---|---|
| Vanhuynh Trung | -- | None Available | |
| Le Tai Phat | -- | None Available | |
| Truong Anthony | -- | None Available | |
| Nguyen Huong Thi | -- | None Available | |
| Le Tai Phat | -- | None Available | |
| Nunez Francisco Pulido | -- | -- |
Source: Public Records
Tax History Compared to Growth
Tax History
| Year | Tax Paid | Tax Assessment Tax Assessment Total Assessment is a certain percentage of the fair market value that is determined by local assessors to be the total taxable value of land and additions on the property. | Land | Improvement |
|---|---|---|---|---|
| 2025 | $532 | $47,319 | -- | -- |
| 2024 | $532 | $43,017 | -- | -- |
| 2023 | $532 | $39,106 | $0 | $0 |
| 2022 | $1,129 | $35,551 | $0 | $0 |
| 2021 | $1,071 | $52,510 | $2,940 | $49,570 |
| 2020 | $402 | $33,500 | $2,940 | $30,560 |
| 2019 | $851 | $26,710 | $2,940 | $23,770 |
| 2018 | $389 | $26,710 | $2,940 | $23,770 |
| 2017 | $371 | $26,710 | $2,940 | $23,770 |
| 2016 | $759 | $26,710 | $2,940 | $23,770 |
| 2015 | $418 | $23,540 | $2,940 | $20,600 |
| 2014 | $418 | $23,540 | $2,940 | $20,600 |
Source: Public Records
Map
Nearby Homes