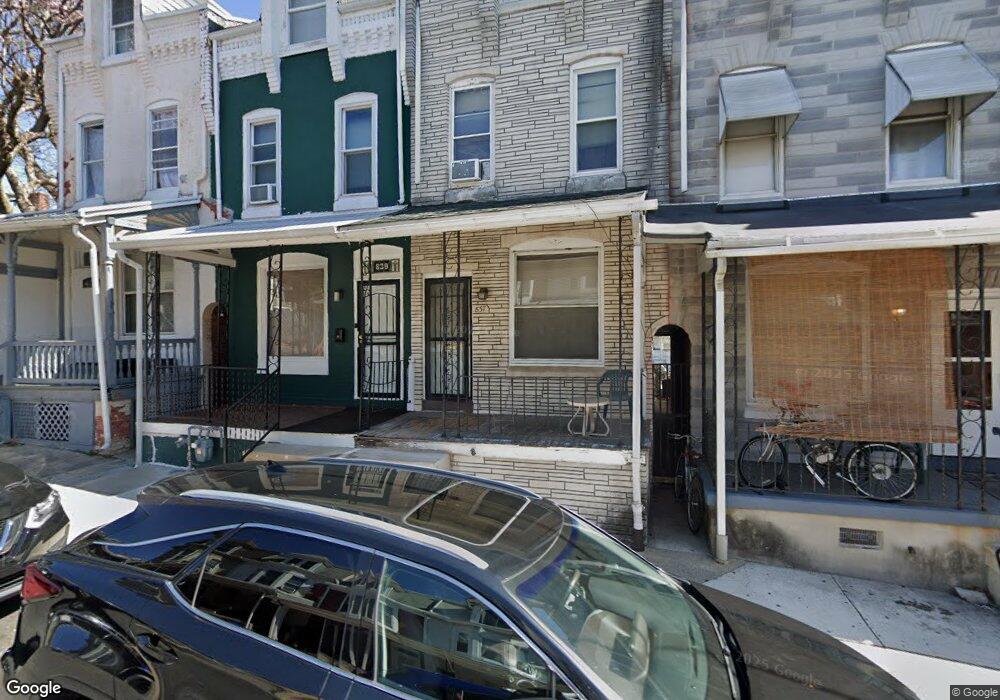
839 Pear St Reading, PA 19601
Northwest Reading NeighborhoodEstimated Value: $132,693 - $195,000
4
Beds
1
Bath
1,582
Sq Ft
$101/Sq Ft
Est. Value
About This Home
This home is located at 839 Pear St, Reading, PA 19601 and is currently estimated at $160,423, approximately $101 per square foot. 839 Pear St is a home located in Berks County with nearby schools including Riverside Elementary School, Northwest Middle School, and Reading Senior High School.
Ownership History
Date
Name
Owned For
Owner Type
Purchase Details
Closed on
Sep 16, 2015
Sold by
Massa Rafael
Bought by
Francisco Altagracia
Current Estimated Value
Purchase Details
Closed on
Feb 27, 2012
Sold by
Brancadora Samuel F
Bought by
Hernandez Carmen Mecedez
Purchase Details
Closed on
Feb 26, 2010
Sold by
Fox Raymond C and Fox Mary Ellen
Bought by
Massa Rafael
Home Financials for this Owner
Home Financials are based on the most recent Mortgage that was taken out on this home.
Original Mortgage
$32,700
Interest Rate
5%
Mortgage Type
New Conventional
Purchase Details
Closed on
Jul 15, 2008
Sold by
Strenko Donna
Bought by
Fox Raymond C and Fox Mary Ellen
Home Financials for this Owner
Home Financials are based on the most recent Mortgage that was taken out on this home.
Original Mortgage
$3,300
Interest Rate
5.93%
Mortgage Type
Unknown
Purchase Details
Closed on
Apr 15, 2004
Sold by
Deutsche Bank National Trust Co
Bought by
Strenko Donna
Purchase Details
Closed on
Mar 16, 2004
Sold by
Mestre Julio C and Martinez Jannette
Bought by
Deutsche Bank National Trust Co
Create a Home Valuation Report for This Property
The Home Valuation Report is an in-depth analysis detailing your home's value as well as a comparison with similar homes in the area
Home Values in the Area
Average Home Value in this Area
Purchase History
| Date | Buyer | Sale Price | Title Company |
|---|---|---|---|
| Francisco Altagracia | $3,000 | None Available | |
| Hernandez Carmen Mecedez | $39,900 | Conestoga Title Insurance | |
| Massa Rafael | $39,900 | None Available | |
| Fox Raymond C | $33,000 | None Available | |
| Strenko Donna | $21,000 | First American Title Ins Co | |
| Deutsche Bank National Trust Co | $11,000 | -- |
Source: Public Records
Mortgage History
| Date | Status | Borrower | Loan Amount |
|---|---|---|---|
| Previous Owner | Massa Rafael | $32,700 | |
| Previous Owner | Fox Raymond C | $3,300 | |
| Previous Owner | Fox Raymond C | $26,400 |
Source: Public Records
Tax History
| Year | Tax Paid | Tax Assessment Tax Assessment Total Assessment is a certain percentage of the fair market value that is determined by local assessors to be the total taxable value of land and additions on the property. | Land | Improvement |
|---|---|---|---|---|
| 2025 | $953 | $35,100 | $9,000 | $26,100 |
| 2024 | $1,559 | $35,100 | $9,000 | $26,100 |
| 2023 | $1,534 | $35,100 | $9,000 | $26,100 |
| 2022 | $1,534 | $35,100 | $9,000 | $26,100 |
| 2021 | $1,534 | $35,100 | $9,000 | $26,100 |
| 2020 | $1,519 | $35,100 | $9,000 | $26,100 |
| 2019 | $1,519 | $35,100 | $9,000 | $26,100 |
| 2018 | $1,519 | $35,100 | $9,000 | $26,100 |
| 2017 | $1,509 | $35,100 | $9,000 | $26,100 |
| 2016 | $862 | $35,100 | $9,000 | $26,100 |
| 2015 | $862 | $35,100 | $9,000 | $26,100 |
| 2014 | $793 | $35,100 | $9,000 | $26,100 |
Source: Public Records
Map
Nearby Homes
- 119 Windsor St
- 852 Thorn St
- 138 W Windsor St
- 725 Pear St
- 815 Weiser St
- 825 N 4th St
- 824 Madison Ave
- 131 W Greenwich St
- 433 Windsor St
- 163 W Greenwich St
- 725 Madison Ave
- 308 Hollenbach St
- 531 N Front St
- 1037 Madison Ave
- 335 Hollenbach St
- 521 Windsor St
- 762 N 6th St
- 425 N 2nd St
- 624 Gordon St
- 413 Rosenthal St
Your Personal Tour Guide
Ask me questions while you tour the home.