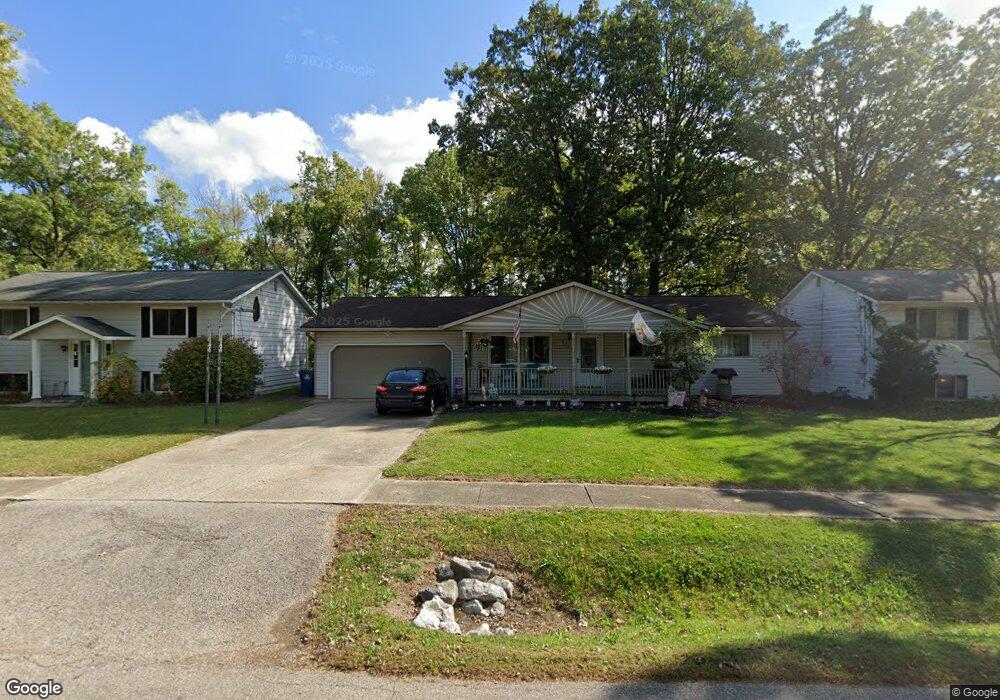
839 Sheffield Rd Sheffield Lake, OH 44054
Estimated Value: $174,000 - $218,000
3
Beds
1
Bath
1,120
Sq Ft
$177/Sq Ft
Est. Value
About This Home
This home is located at 839 Sheffield Rd, Sheffield Lake, OH 44054 and is currently estimated at $197,837, approximately $176 per square foot. 839 Sheffield Rd is a home located in Lorain County with nearby schools including Knollwood Elementary School, Brookside Intermediate School, and Brookside Middle School.
Ownership History
Date
Name
Owned For
Owner Type
Purchase Details
Closed on
Feb 1, 2011
Sold by
Fannie Mae
Bought by
Cantrell Sunshine A
Current Estimated Value
Home Financials for this Owner
Home Financials are based on the most recent Mortgage that was taken out on this home.
Original Mortgage
$33,600
Outstanding Balance
$23,068
Interest Rate
4.85%
Mortgage Type
New Conventional
Estimated Equity
$174,769
Purchase Details
Closed on
Jun 11, 2010
Sold by
Nieves Celestino
Bought by
Federal National Mortgage Association
Purchase Details
Closed on
Nov 23, 1998
Sold by
Martin Bill R and Martin Nadene M
Bought by
Nieves Celestino
Home Financials for this Owner
Home Financials are based on the most recent Mortgage that was taken out on this home.
Original Mortgage
$101,841
Interest Rate
6.93%
Mortgage Type
FHA
Create a Home Valuation Report for This Property
The Home Valuation Report is an in-depth analysis detailing your home's value as well as a comparison with similar homes in the area
Home Values in the Area
Average Home Value in this Area
Purchase History
| Date | Buyer | Sale Price | Title Company |
|---|---|---|---|
| Cantrell Sunshine A | $42,000 | Omega Title Agency Llc | |
| Federal National Mortgage Association | $112,832 | Attorney | |
| Nieves Celestino | $102,000 | -- |
Source: Public Records
Mortgage History
| Date | Status | Borrower | Loan Amount |
|---|---|---|---|
| Open | Cantrell Sunshine A | $33,600 | |
| Previous Owner | Nieves Celestino | $101,841 |
Source: Public Records
Tax History Compared to Growth
Tax History
| Year | Tax Paid | Tax Assessment Tax Assessment Total Assessment is a certain percentage of the fair market value that is determined by local assessors to be the total taxable value of land and additions on the property. | Land | Improvement |
|---|---|---|---|---|
| 2024 | $2,783 | $53,456 | $8,418 | $45,038 |
| 2023 | $2,300 | $38,850 | $7,830 | $31,021 |
| 2022 | $2,278 | $38,850 | $7,830 | $31,021 |
| 2021 | $2,292 | $38,850 | $7,830 | $31,020 |
| 2020 | $2,210 | $34,270 | $6,910 | $27,360 |
| 2019 | $2,197 | $34,270 | $6,910 | $27,360 |
| 2018 | $2,206 | $34,270 | $6,910 | $27,360 |
| 2017 | $2,825 | $40,020 | $7,950 | $32,070 |
| 2016 | $2,851 | $40,020 | $7,950 | $32,070 |
| 2015 | $2,814 | $40,020 | $7,950 | $32,070 |
| 2014 | $2,290 | $35,900 | $7,130 | $28,770 |
| 2013 | $2,280 | $35,900 | $7,130 | $28,770 |
Source: Public Records
Map
Nearby Homes
- 737 Dunny Ave
- 4154 Belle Ave
- 885 Lake Breeze Rd
- 4260 Brockley Ave
- 4272 Brockley Ave
- 4283 Holl Ave
- 646 Dunny Ave
- 0 Kenilworth Ave
- 4286 Holl Ave
- 662 Kenilworth Ave
- 786 Oliver St
- 644 Pasadena Ave
- 640 Pasadena Ave
- 827 West Dr
- 931 East Dr
- 738 W Shore Blvd
- 819 Warwick Dr
- 762 Maplewood Ave
- VL Maplewood Ave
- 580 Alameda Ave
- 851 Sheffield Rd
- 835 Sheffield Rd
- 829 Sheffield Rd
- 844 Sheffield Rd
- 848 Sheffield Rd
- 832 Sheffield Rd
- 858 Sheffield Rd
- 815 Sheffield Rd
- 820 Sheffield Rd
- 860 Sheffield Rd
- 847 Community Rd
- 835 Community Rd
- 809 Sheffield Rd
- 851 Community Rd
- 810 Sheffield Rd
- 823 Community Rd
- 870 Sheffield Rd
- 857 Community Rd
- 801 Sheffield Rd
- 863 Community Rd