839 State Rd Dartmouth, MA 02747
Smith Mills NeighborhoodEstimated Value: $417,182
--
Bed
2
Baths
2,160
Sq Ft
$193/Sq Ft
Est. Value
About This Home
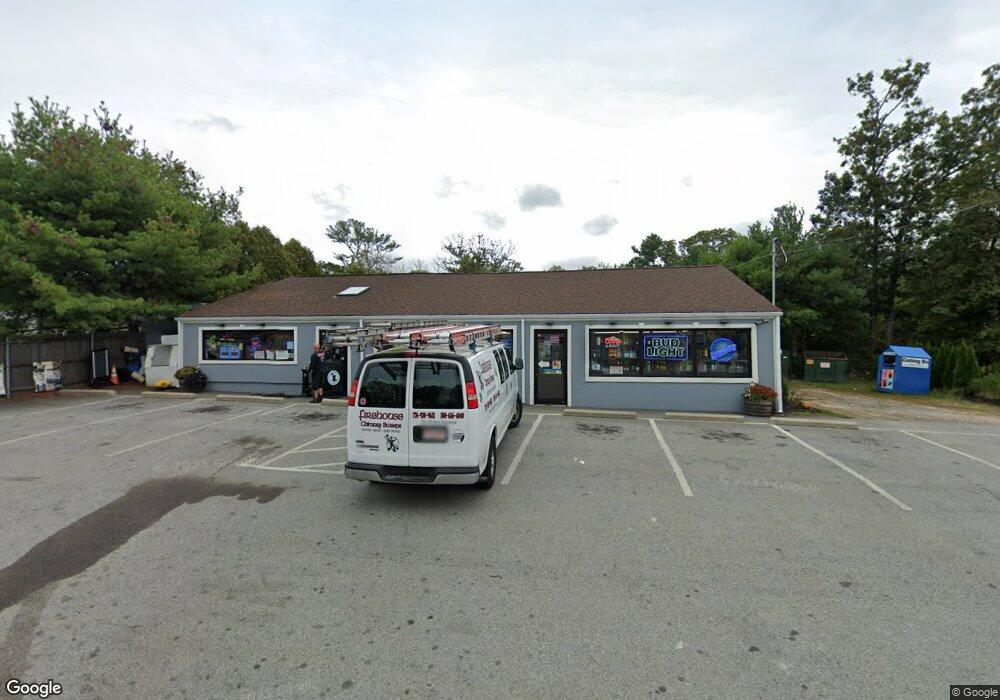
This home is located at 839 State Rd, Dartmouth, MA 02747 and is currently estimated at $417,182, approximately $193 per square foot. 839 State Rd is a home located in Bristol County with nearby schools including Dartmouth High School, Nazarene Christian Academy, and Bishop Stang High School.
Ownership History
Date
Name
Owned For
Owner Type
Purchase Details
Closed on
Dec 17, 2010
Sold by
Chedid Wassim
Bought by
Ngja Llc
Current Estimated Value
Home Financials for this Owner
Home Financials are based on the most recent Mortgage that was taken out on this home.
Original Mortgage
$200,000
Outstanding Balance
$133,652
Interest Rate
4.37%
Mortgage Type
Commercial
Estimated Equity
$283,530
Purchase Details
Closed on
May 28, 2010
Sold by
Boulos Josephine
Bought by
Chedid Wassim
Purchase Details
Closed on
Dec 1, 2003
Sold by
Star Video Inc
Bought by
Fernandes Kevin
Home Financials for this Owner
Home Financials are based on the most recent Mortgage that was taken out on this home.
Original Mortgage
$112,500
Interest Rate
6.09%
Mortgage Type
Commercial
Create a Home Valuation Report for This Property
The Home Valuation Report is an in-depth analysis detailing your home's value as well as a comparison with similar homes in the area
Home Values in the Area
Average Home Value in this Area
Purchase History
| Date | Buyer | Sale Price | Title Company |
|---|---|---|---|
| Ngja Llc | -- | -- | |
| Chedid Wassim | -- | -- | |
| Boulos Josephine | $180,000 | -- | |
| Fernandes Kevin | $150,000 | -- |
Source: Public Records
Mortgage History
| Date | Status | Borrower | Loan Amount |
|---|---|---|---|
| Open | Fernandes Kevin | $200,000 | |
| Previous Owner | Fernandes Kevin | $112,500 | |
| Previous Owner | Fernandes Kevin | $37,139 |
Source: Public Records
Tax History Compared to Growth
Tax History
| Year | Tax Paid | Tax Assessment Tax Assessment Total Assessment is a certain percentage of the fair market value that is determined by local assessors to be the total taxable value of land and additions on the property. | Land | Improvement |
|---|---|---|---|---|
| 2025 | $5,273 | $286,400 | $166,500 | $119,900 |
| 2024 | $5,204 | $279,200 | $159,300 | $119,900 |
| 2023 | $4,670 | $241,700 | $144,800 | $96,900 |
| 2022 | $4,469 | $233,000 | $136,100 | $96,900 |
| 2021 | $3,904 | $200,700 | $122,800 | $77,900 |
| 2020 | $3,873 | $208,200 | $125,500 | $82,700 |
| 2019 | $3,796 | $211,600 | $124,200 | $87,400 |
| 2018 | $3,569 | $212,900 | $120,700 | $92,200 |
| 2017 | $3,817 | $219,600 | $122,700 | $96,900 |
| 2016 | $3,851 | $232,800 | $131,100 | $101,700 |
| 2015 | $3,933 | $238,800 | $132,400 | $106,400 |
| 2014 | $3,698 | $227,000 | $115,800 | $111,200 |
Source: Public Records
Map
Nearby Homes
- 461 Reed Rd
- 3 Roller Coaster Way Unit Lot 1
- 29 Union Ave
- 735 Reed Rd
- 96 Forge Rd
- 56 Lakeside Ave
- 55 Lakeside Ave
- 818 Reed Rd
- 320 Old Westport Rd
- 27 Dias Ave
- 312 Old Westport Rd
- 310 Old Westport Rd
- 53 Morton Ave
- 65 Cross Rd
- 16 S Berryman St
- 15 S Breault St
- 565 Highland Ave
- Lot 6 Rafael Rd
- 4 Sabrinas Way
- 0 Van Buren St