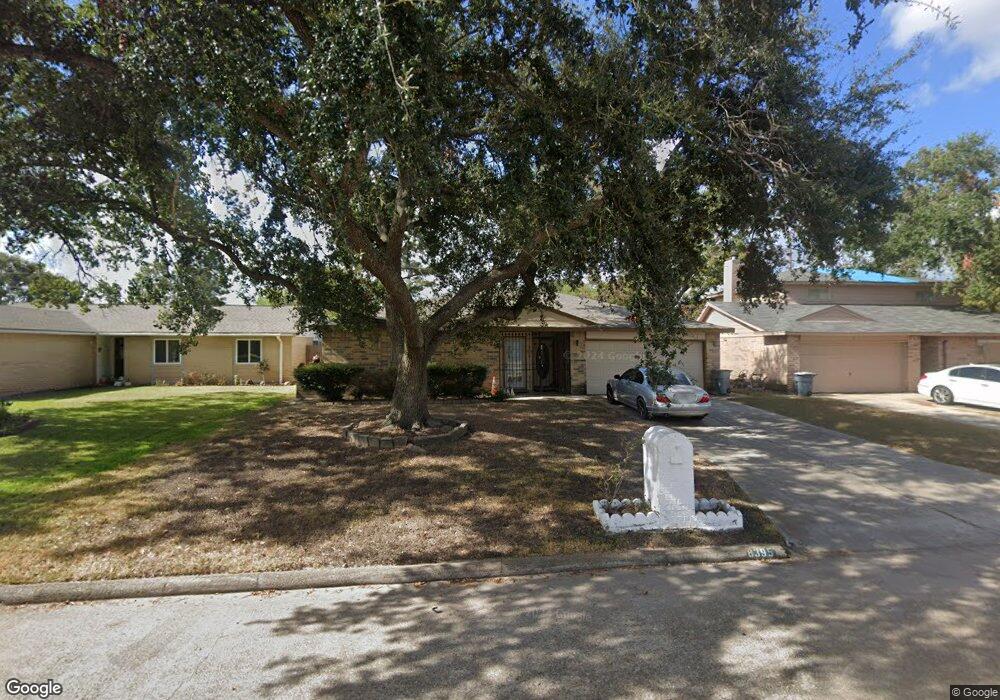
8395 Pebbledowne Dr Houston, TX 77064
North Houston NeighborhoodEstimated Value: $219,928 - $258,000
4
Beds
2
Baths
1,622
Sq Ft
$147/Sq Ft
Est. Value
About This Home
This home is located at 8395 Pebbledowne Dr, Houston, TX 77064 and is currently estimated at $237,982, approximately $146 per square foot. 8395 Pebbledowne Dr is a home located in Harris County with nearby schools including Frazier Elementary School, Cook Middle School, and Jersey Village High School.
Ownership History
Date
Name
Owned For
Owner Type
Purchase Details
Closed on
Jun 1, 2012
Sold by
Huynh Quyen My and Nguyen Huyen Duong
Bought by
Infante Ramon Rodriguez and Gonzalez Rosa Estrada
Current Estimated Value
Home Financials for this Owner
Home Financials are based on the most recent Mortgage that was taken out on this home.
Original Mortgage
$86,406
Outstanding Balance
$59,995
Interest Rate
3.87%
Mortgage Type
FHA
Estimated Equity
$177,987
Create a Home Valuation Report for This Property
The Home Valuation Report is an in-depth analysis detailing your home's value as well as a comparison with similar homes in the area
Home Values in the Area
Average Home Value in this Area
Purchase History
| Date | Buyer | Sale Price | Title Company |
|---|---|---|---|
| Infante Ramon Rodriguez | -- | None Available |
Source: Public Records
Mortgage History
| Date | Status | Borrower | Loan Amount |
|---|---|---|---|
| Open | Infante Ramon Rodriguez | $86,406 |
Source: Public Records
Tax History Compared to Growth
Tax History
| Year | Tax Paid | Tax Assessment Tax Assessment Total Assessment is a certain percentage of the fair market value that is determined by local assessors to be the total taxable value of land and additions on the property. | Land | Improvement |
|---|---|---|---|---|
| 2025 | $1,991 | $217,586 | $50,779 | $166,807 |
| 2024 | $1,991 | $212,716 | $50,779 | $161,937 |
| 2023 | $1,991 | $210,419 | $50,779 | $159,640 |
| 2022 | $4,155 | $181,323 | $36,271 | $145,052 |
| 2021 | $3,981 | $155,073 | $36,271 | $118,802 |
| 2020 | $3,834 | $143,362 | $30,278 | $113,084 |
| 2019 | $3,762 | $136,513 | $20,816 | $115,697 |
| 2018 | $1,102 | $127,772 | $20,816 | $106,956 |
| 2017 | $3,203 | $127,772 | $20,816 | $106,956 |
| 2016 | $2,912 | $119,744 | $17,347 | $102,397 |
| 2015 | $1,889 | $106,990 | $17,347 | $89,643 |
| 2014 | $1,889 | $86,671 | $12,301 | $74,370 |
Source: Public Records
Map
Nearby Homes
- 7615 Fur Market Dr
- 8326 Sorrel Dr
- 8406 Daycoach Ln
- 7535 Roaring Springs Dr
- 7727 Westbank Ave
- 7911 Bova Rd
- 7671 Bubbling Spring Ln
- 5715 & 5721 Spindle Dr
- 5624 Spindle Dr
- 7926 Westington Ln
- 7706 Cloverlake Ct
- 7650 Smiling Wood Ln
- 10515 Ince Ln
- 8603 Little River Rd
- 7510 Bubbling Spring Ln
- 7602 Smiling Wood Ln
- 8115 Oahu Ct
- 6508 Redcliff Rd
- 8202 Terrace Brook Dr
- 7122 Breen Dr
- 8391 Pebbledowne Dr
- 8399 Pebbledowne Dr
- 8382 Sorrel Dr
- 8387 Pebbledowne Dr
- 8378 Sorrel Dr
- 8386 Sorrel Dr
- 8374 Sorrel Dr
- 8394 Pebbledowne Dr
- 8383 Pebbledowne Dr
- 8390 Pebbledowne Dr
- 8398 Pebbledowne Dr
- 8370 Sorrel Dr
- 8386 Pebbledowne Dr
- 8379 Pebbledowne Dr
- 8403 Pebbledowne Dr
- 8382 Pebbledowne Dr
- 8402 Sorrel Dr
- 8366 Sorrel Dr
- 8383 Sorrel Dr
- 8387 Sorrel Dr