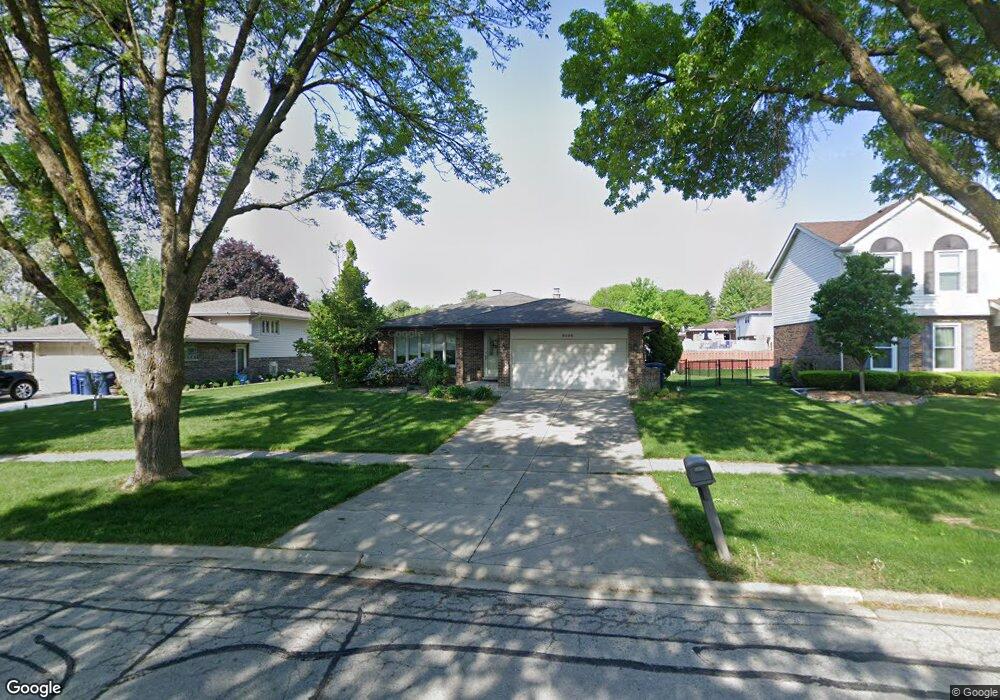
8396 Cramer Ln Darien, IL 60561
South Woodridge NeighborhoodEstimated Value: $405,490 - $517,000
3
Beds
2
Baths
1,284
Sq Ft
$368/Sq Ft
Est. Value
About This Home
This home is located at 8396 Cramer Ln, Darien, IL 60561 and is currently estimated at $472,623, approximately $368 per square foot. 8396 Cramer Ln is a home located in DuPage County with nearby schools including Prairieview Elementary School, Elizabeth Ide Elementary School, and Lakeview Jr High School.
Ownership History
Date
Name
Owned For
Owner Type
Purchase Details
Closed on
Mar 15, 2006
Sold by
Bailie Robert C and Bailie Erin P
Bought by
Izzi Michael A and Izzi Agnes
Current Estimated Value
Home Financials for this Owner
Home Financials are based on the most recent Mortgage that was taken out on this home.
Original Mortgage
$272,000
Outstanding Balance
$155,172
Interest Rate
6.33%
Mortgage Type
Fannie Mae Freddie Mac
Estimated Equity
$317,451
Purchase Details
Closed on
Aug 18, 2003
Sold by
Arellano Vicente C and Arellano Lidia E
Bought by
Bailie Robert C and Bailie Erin P
Home Financials for this Owner
Home Financials are based on the most recent Mortgage that was taken out on this home.
Original Mortgage
$220,000
Interest Rate
6.33%
Mortgage Type
Balloon
Purchase Details
Closed on
Nov 12, 1998
Sold by
Moyano Francisco J and Moyano Vita A
Bought by
Arellano Vicente C and Arellano Lidia E
Create a Home Valuation Report for This Property
The Home Valuation Report is an in-depth analysis detailing your home's value as well as a comparison with similar homes in the area
Home Values in the Area
Average Home Value in this Area
Purchase History
| Date | Buyer | Sale Price | Title Company |
|---|---|---|---|
| Izzi Michael A | $340,000 | Ticor Title Insurance Compan | |
| Bailie Robert C | $275,000 | Pntn | |
| Arellano Vicente C | $197,000 | -- |
Source: Public Records
Mortgage History
| Date | Status | Borrower | Loan Amount |
|---|---|---|---|
| Open | Izzi Michael A | $272,000 | |
| Previous Owner | Bailie Robert C | $220,000 |
Source: Public Records
Tax History
| Year | Tax Paid | Tax Assessment Tax Assessment Total Assessment is a certain percentage of the fair market value that is determined by local assessors to be the total taxable value of land and additions on the property. | Land | Improvement |
|---|---|---|---|---|
| 2024 | $7,047 | $122,171 | $53,890 | $68,281 |
| 2023 | $6,756 | $112,310 | $49,540 | $62,770 |
| 2022 | $6,409 | $106,050 | $47,140 | $58,910 |
| 2021 | $5,884 | $104,840 | $46,600 | $58,240 |
| 2020 | $5,782 | $102,770 | $45,680 | $57,090 |
| 2019 | $5,590 | $98,610 | $43,830 | $54,780 |
| 2018 | $5,609 | $97,110 | $43,690 | $53,420 |
| 2017 | $5,350 | $93,440 | $42,040 | $51,400 |
| 2016 | $5,090 | $89,170 | $40,120 | $49,050 |
| 2015 | $5,007 | $83,900 | $37,750 | $46,150 |
| 2014 | $4,913 | $81,570 | $36,700 | $44,870 |
| 2013 | $5,001 | $80,790 | $36,530 | $44,260 |
Source: Public Records
Map
Nearby Homes
- 3432 Drover Ln
- 8484 Liberty Ln
- 8497 Liberty Ln
- 1886 Fulton St
- 1882 Fulton St
- 1878 Fulton St
- 1870 Fulton St
- 1874 Fulton St
- 1866 Fulton St
- 8528 Chadwick Ct
- 8505 Woodward Ave Unit 201
- 8537 Chadwick Ct
- 8540 Chadwick Ct
- 8534 Sperry Ct
- 8544 Chadwick Ct
- 8545 Chadwick Ct
- 8535 Sperry Ct
- 8551 Sperry Ct
- 8146 Hampton Dr
- 1721 Harcourt Dr
Your Personal Tour Guide
Ask me questions while you tour the home.