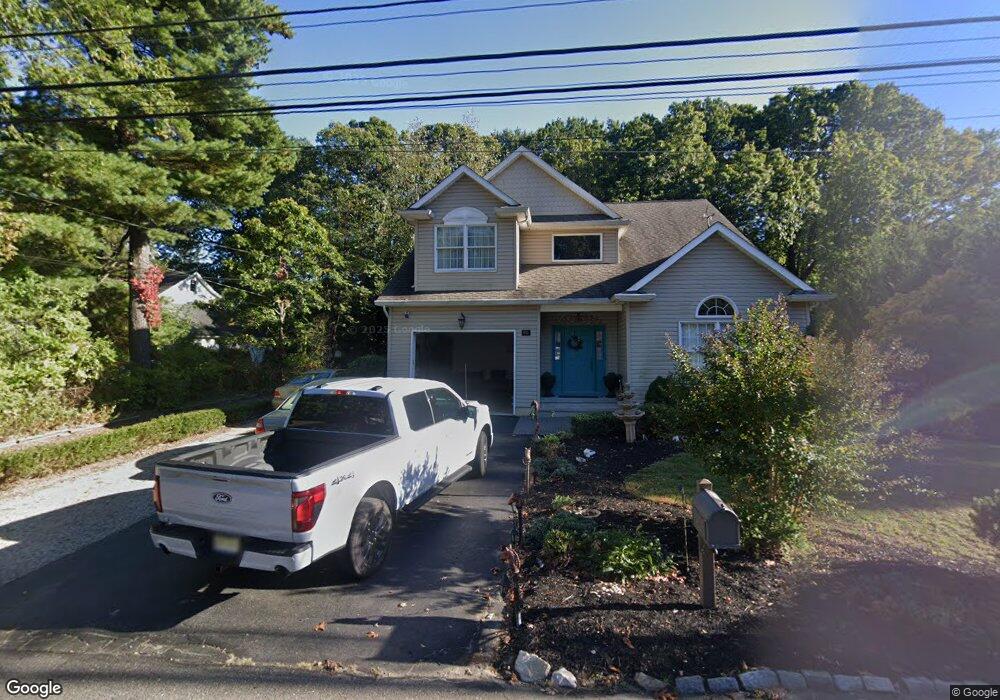
83B Squankum Rd Eatontown, NJ 07724
Estimated Value: $580,000 - $721,000
3
Beds
2
Baths
1,988
Sq Ft
$330/Sq Ft
Est. Value
About This Home
This home is located at 83B Squankum Rd, Eatontown, NJ 07724 and is currently estimated at $656,071, approximately $330 per square foot. 83B Squankum Rd is a home located in Monmouth County with nearby schools including Mahala F. Atchinson Elementary School, Swimming River Elementary School, and Tinton Falls Middle School.
Ownership History
Date
Name
Owned For
Owner Type
Purchase Details
Closed on
Jan 13, 2013
Sold by
Smock Thomas and Smock Hazel
Bought by
Smock Simon C and Smock Jennifer R
Current Estimated Value
Home Financials for this Owner
Home Financials are based on the most recent Mortgage that was taken out on this home.
Original Mortgage
$145,000
Interest Rate
3.39%
Mortgage Type
Purchase Money Mortgage
Purchase Details
Closed on
Apr 28, 2008
Sold by
Household Finance Corp Iii
Bought by
Smock Thomas and Smock Hazel
Purchase Details
Closed on
Oct 15, 2004
Sold by
Saunders Randy
Bought by
Saunders Dawn
Home Financials for this Owner
Home Financials are based on the most recent Mortgage that was taken out on this home.
Original Mortgage
$140,000
Interest Rate
5.71%
Create a Home Valuation Report for This Property
The Home Valuation Report is an in-depth analysis detailing your home's value as well as a comparison with similar homes in the area
Home Values in the Area
Average Home Value in this Area
Purchase History
| Date | Buyer | Sale Price | Title Company |
|---|---|---|---|
| Smock Simon C | $145,000 | Agent For Old Republic Natio | |
| Smock Thomas | $151,500 | Trident Abstract Title Agenc | |
| Saunders Dawn | $315,000 | -- |
Source: Public Records
Mortgage History
| Date | Status | Borrower | Loan Amount |
|---|---|---|---|
| Closed | Smock Simon C | $145,000 | |
| Previous Owner | Saunders Dawn | $140,000 |
Source: Public Records
Tax History Compared to Growth
Tax History
| Year | Tax Paid | Tax Assessment Tax Assessment Total Assessment is a certain percentage of the fair market value that is determined by local assessors to be the total taxable value of land and additions on the property. | Land | Improvement |
|---|---|---|---|---|
| 2025 | $6,096 | $433,600 | $232,000 | $201,600 |
| 2024 | $5,976 | $423,600 | $208,100 | $215,500 |
| 2023 | $5,976 | $391,600 | $183,200 | $208,400 |
| 2022 | $5,547 | $321,400 | $157,500 | $163,900 |
| 2021 | $5,547 | $288,000 | $157,500 | $130,500 |
| 2020 | $5,301 | $265,700 | $138,200 | $127,500 |
| 2019 | $5,279 | $265,000 | $138,200 | $126,800 |
| 2018 | $4,781 | $239,300 | $127,900 | $111,400 |
| 2017 | $4,834 | $235,900 | $127,900 | $108,000 |
| 2016 | $5,141 | $245,300 | $131,100 | $114,200 |
| 2015 | $5,018 | $242,400 | $131,100 | $111,300 |
| 2014 | $5,512 | $254,700 | $131,100 | $123,600 |
Source: Public Records
Map
Nearby Homes