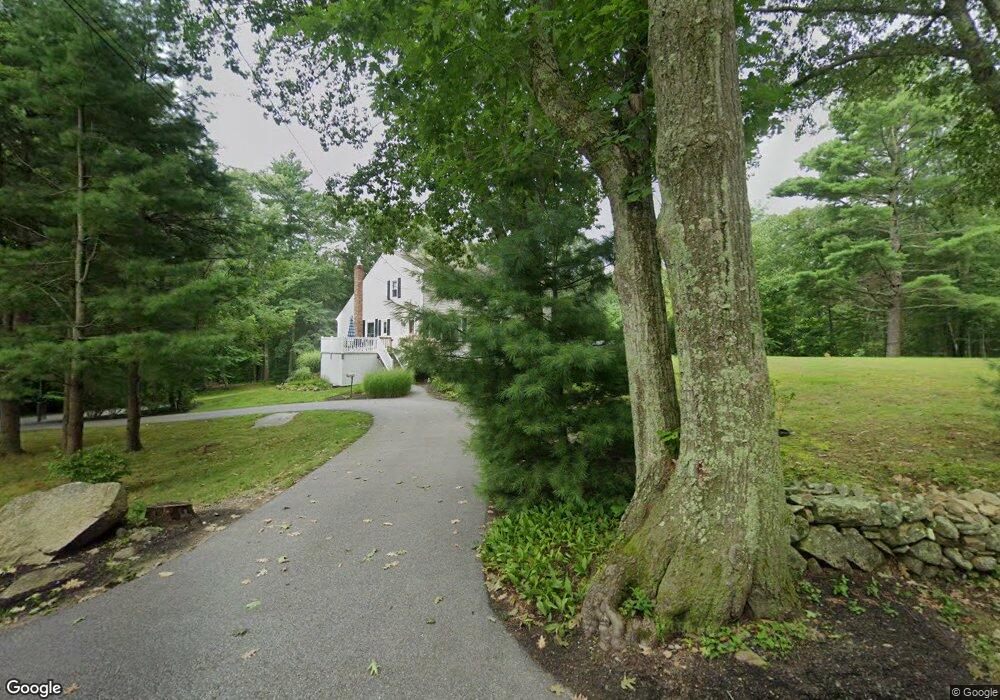
84 Buffum Rd Uxbridge, MA 01569
Estimated Value: $586,000 - $706,000
3
Beds
2
Baths
2,166
Sq Ft
$299/Sq Ft
Est. Value
About This Home
This home is located at 84 Buffum Rd, Uxbridge, MA 01569 and is currently estimated at $648,244, approximately $299 per square foot. 84 Buffum Rd is a home located in Worcester County with nearby schools including Uxbridge High School.
Ownership History
Date
Name
Owned For
Owner Type
Purchase Details
Closed on
Jul 26, 2002
Sold by
Makely Geoffrey S and Makely Trenna L
Bought by
Paravano Anthony and Paravano Charlotte
Current Estimated Value
Home Financials for this Owner
Home Financials are based on the most recent Mortgage that was taken out on this home.
Original Mortgage
$293,550
Outstanding Balance
$125,813
Interest Rate
6.73%
Mortgage Type
Purchase Money Mortgage
Estimated Equity
$522,431
Purchase Details
Closed on
Aug 15, 2001
Sold by
Wischinski Rainer H and Wischinski Anita
Bought by
Makely Geoffrey S and Makely Trenna L
Purchase Details
Closed on
Jul 31, 2000
Sold by
Place Marie L
Bought by
Wischinski Rainer H and Wischinski Anita
Purchase Details
Closed on
Jul 1, 1998
Sold by
Hanny Scribner T and Hanny Janice K
Bought by
Place Marie L
Create a Home Valuation Report for This Property
The Home Valuation Report is an in-depth analysis detailing your home's value as well as a comparison with similar homes in the area
Home Values in the Area
Average Home Value in this Area
Purchase History
| Date | Buyer | Sale Price | Title Company |
|---|---|---|---|
| Paravano Anthony | $309,000 | -- | |
| Makely Geoffrey S | $259,900 | -- | |
| Wischinski Rainer H | $230,000 | -- | |
| Place Marie L | $185,000 | -- |
Source: Public Records
Mortgage History
| Date | Status | Borrower | Loan Amount |
|---|---|---|---|
| Open | Place Marie L | $84,000 | |
| Closed | Place Marie L | $65,000 | |
| Open | Place Marie L | $293,550 |
Source: Public Records
Tax History
| Year | Tax Paid | Tax Assessment Tax Assessment Total Assessment is a certain percentage of the fair market value that is determined by local assessors to be the total taxable value of land and additions on the property. | Land | Improvement |
|---|---|---|---|---|
| 2025 | $6,572 | $501,300 | $174,000 | $327,300 |
| 2024 | $6,364 | $492,600 | $165,300 | $327,300 |
| 2023 | $5,646 | $404,700 | $142,600 | $262,100 |
| 2022 | $5,411 | $356,900 | $125,200 | $231,700 |
| 2021 | $5,440 | $343,900 | $122,600 | $221,300 |
| 2020 | $5,127 | $306,300 | $120,800 | $185,500 |
| 2019 | $5,314 | $306,300 | $120,800 | $185,500 |
| 2018 | $5,244 | $305,400 | $120,800 | $184,600 |
| 2017 | $4,564 | $269,100 | $111,100 | $158,000 |
| 2016 | $4,711 | $268,100 | $105,800 | $162,300 |
| 2015 | $4,608 | $264,800 | $105,800 | $159,000 |
Source: Public Records
Map
Nearby Homes
- 1 White Ct
- 296 Yew St
- 153 Davis St
- 405 West St
- 99 Maple St
- 13 Perry St
- 279 S East Main St Unit Lot 2
- 295 S East Main St Unit Lot 6
- 299 S East Main St Unit Lot 7
- 303 S East Main St Unit Lot 8
- 307 S East Main St Unit Lot 9
- 139 Turner Farm Rd
- 145 Turner Farm Rd
- 127 Turner Farm Rd
- 145 Mantell Rd
- 169 Mantell Rd
- 137 Mantell Rd
- 136 Turner Farm Rd
- 126 Turner Farm Rd
- 114 Turner Farm Rd
Your Personal Tour Guide
Ask me questions while you tour the home.