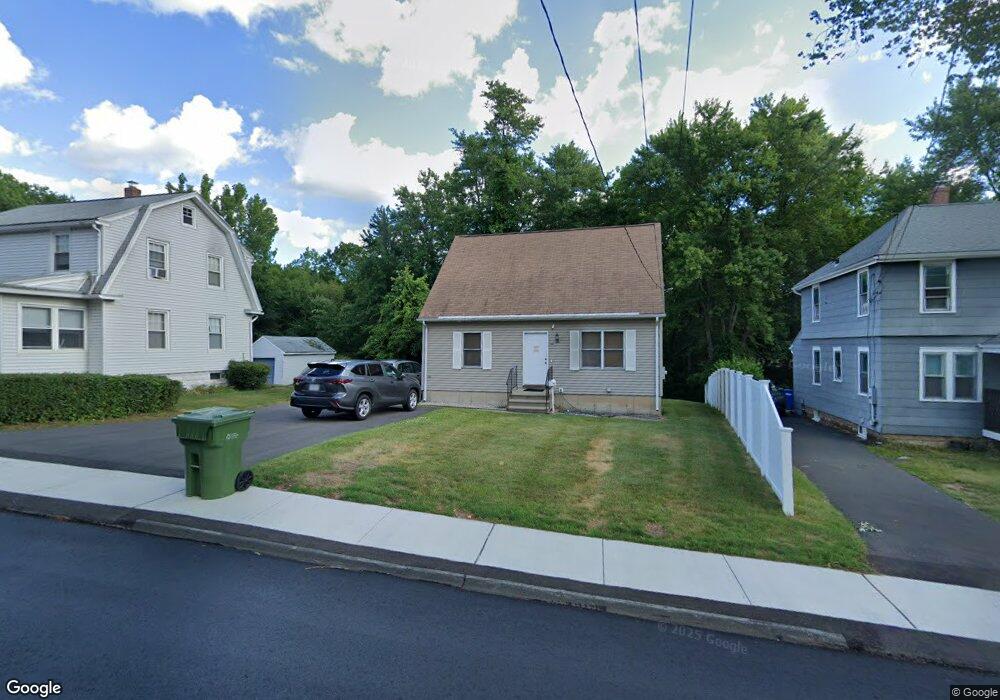
84 Capen St Windsor, CT 06095
Estimated Value: $313,000 - $365,000
3
Beds
2
Baths
1,128
Sq Ft
$302/Sq Ft
Est. Value
About This Home
This home is located at 84 Capen St, Windsor, CT 06095 and is currently estimated at $341,145, approximately $302 per square foot. 84 Capen St is a home located in Hartford County with nearby schools including Oliver Ellsworth School, John F. Kennedy School, and Sage Park Middle School.
Ownership History
Date
Name
Owned For
Owner Type
Purchase Details
Closed on
Oct 29, 2001
Sold by
Corbett Frank and Corbett Patricia
Bought by
Samuels Mark and Cummings Stacy Ann
Current Estimated Value
Home Financials for this Owner
Home Financials are based on the most recent Mortgage that was taken out on this home.
Original Mortgage
$132,000
Interest Rate
6.86%
Mortgage Type
Purchase Money Mortgage
Purchase Details
Closed on
Sep 12, 2000
Sold by
Jameson Charlotte and Jameson Ellen
Bought by
Corbett Frank and Corbett Patricia
Create a Home Valuation Report for This Property
The Home Valuation Report is an in-depth analysis detailing your home's value as well as a comparison with similar homes in the area
Home Values in the Area
Average Home Value in this Area
Purchase History
We collect this data history from publicly available records. To have your information removed, we recommend requesting removal directly through your county’s website.
| Date | Buyer | Sale Price | Title Company |
|---|---|---|---|
| Samuels Mark | $140,000 | -- | |
| Corbett Frank | $25,000 | -- |
Source: Public Records
Mortgage History
We collect this data history from publicly available records. To have your information removed, we recommend requesting removal directly through your county’s website.
| Date | Status | Borrower | Loan Amount |
|---|---|---|---|
| Open | Corbett Frank | $143,900 | |
| Closed | Corbett Frank | $132,000 |
Source: Public Records
Tax History
| Year | Tax Paid | Tax Assessment Tax Assessment Total Assessment is a certain percentage of the fair market value that is determined by local assessors to be the total taxable value of land and additions on the property. | Land | Improvement |
|---|---|---|---|---|
| 2025 | $5,534 | $186,340 | $58,800 | $127,540 |
| 2024 | $5,929 | $186,340 | $58,800 | $127,540 |
| 2023 | $4,204 | $119,770 | $46,270 | $73,500 |
| 2022 | $4,164 | $119,770 | $46,270 | $73,500 |
| 2021 | $4,194 | $119,770 | $46,270 | $73,500 |
| 2020 | $4,145 | $119,770 | $46,270 | $73,500 |
| 2019 | $4,058 | $119,770 | $46,270 | $73,500 |
| 2018 | $4,126 | $118,020 | $46,270 | $71,750 |
| 2017 | $3,830 | $118,020 | $46,270 | $71,750 |
| 2016 | $3,720 | $118,020 | $46,270 | $71,750 |
| 2015 | $3,649 | $118,020 | $46,270 | $71,750 |
| 2014 | $3,596 | $118,020 | $46,270 | $71,750 |
Source: Public Records
Map
Nearby Homes
Your Personal Tour Guide
Ask me questions while you tour the home.