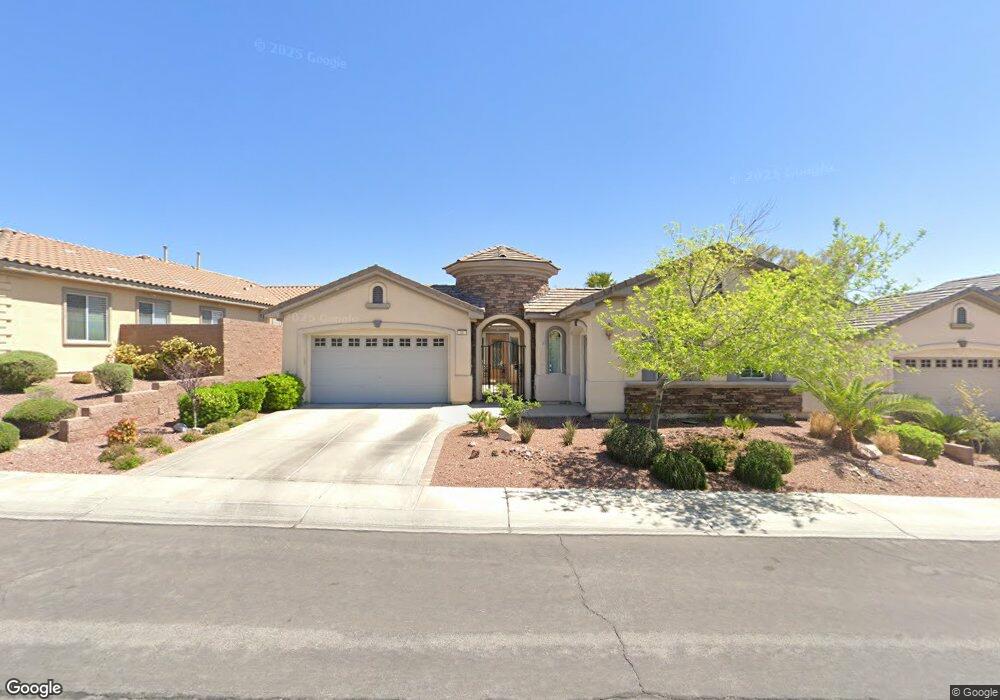
84 Chapman Heights St Unit 3 Las Vegas, NV 89138
Estimated Value: $944,365 - $1,114,000
4
Beds
3
Baths
2,778
Sq Ft
$360/Sq Ft
Est. Value
About This Home
This home is located at 84 Chapman Heights St Unit 3, Las Vegas, NV 89138 and is currently estimated at $999,591, approximately $359 per square foot. 84 Chapman Heights St Unit 3 is a home located in Clark County with nearby schools including Linda Rankin Givens Elementary School, Sig Rogich Middle School, and Palo Verde High School.
Ownership History
Date
Name
Owned For
Owner Type
Purchase Details
Closed on
Oct 10, 2016
Sold by
21St Mortgage Corp
Bought by
Qin Qi and Li Dan
Current Estimated Value
Purchase Details
Closed on
May 4, 2016
Sold by
Weber Mary Lynn
Bought by
21St Mortgage Corporation
Purchase Details
Closed on
Sep 28, 2004
Sold by
Wilson Gary
Bought by
Weber Mary Lynn
Home Financials for this Owner
Home Financials are based on the most recent Mortgage that was taken out on this home.
Original Mortgage
$516,000
Interest Rate
1%
Mortgage Type
New Conventional
Purchase Details
Closed on
May 17, 2004
Sold by
Wilson Jo Ann
Bought by
Wilson Gary
Purchase Details
Closed on
Aug 1, 2003
Sold by
Wilson Jo Ann
Bought by
Wilson Gary
Home Financials for this Owner
Home Financials are based on the most recent Mortgage that was taken out on this home.
Original Mortgage
$305,642
Interest Rate
8.25%
Mortgage Type
Unknown
Create a Home Valuation Report for This Property
The Home Valuation Report is an in-depth analysis detailing your home's value as well as a comparison with similar homes in the area
Home Values in the Area
Average Home Value in this Area
Purchase History
| Date | Buyer | Sale Price | Title Company |
|---|---|---|---|
| Qin Qi | $472,000 | Netco | |
| 21St Mortgage Corporation | $691,178 | None Available | |
| Weber Mary Lynn | $645,000 | Stewart Title Of Nevada | |
| Wilson Gary | $645,000 | Stewart Title Of Nevada | |
| Wilson Gary | -- | Land Title Of Nevada | |
| Wilson Gary | $382,053 | Fidelity National Title | |
| Wilson Gary | $382,053 | Fidelity National Title |
Source: Public Records
Mortgage History
| Date | Status | Borrower | Loan Amount |
|---|---|---|---|
| Previous Owner | Weber Mary Lynn | $516,000 | |
| Previous Owner | Wilson Gary | $305,642 | |
| Closed | Wilson Gary | $76,410 | |
| Closed | Weber Mary Lynn | $64,450 |
Source: Public Records
Tax History Compared to Growth
Tax History
| Year | Tax Paid | Tax Assessment Tax Assessment Total Assessment is a certain percentage of the fair market value that is determined by local assessors to be the total taxable value of land and additions on the property. | Land | Improvement |
|---|---|---|---|---|
| 2025 | $5,063 | $227,307 | $91,700 | $135,607 |
| 2024 | $4,916 | $227,307 | $91,700 | $135,607 |
| 2023 | $4,916 | $191,869 | $64,050 | $127,819 |
| 2022 | $4,773 | $172,283 | $55,650 | $116,633 |
| 2021 | $4,633 | $160,125 | $49,350 | $110,775 |
| 2020 | $4,495 | $156,186 | $46,550 | $109,636 |
| 2019 | $4,362 | $151,291 | $43,750 | $107,541 |
| 2018 | $4,233 | $140,326 | $36,750 | $103,576 |
| 2017 | $4,523 | $137,783 | $32,900 | $104,883 |
| 2016 | $4,007 | $129,793 | $25,725 | $104,068 |
| 2015 | $4,000 | $127,251 | $25,725 | $101,526 |
| 2014 | $3,883 | $114,726 | $15,803 | $98,923 |
Source: Public Records
Map
Nearby Homes
- 11550 Lampeter Ct
- 11589 Caldicot Dr
- 216 Muldowney Ln
- 11554 Trevi Fountain Ave
- 12230 Elderwood St
- 454 Carter House Ave
- 489 Carter House Ave
- 11831 Giroma Ave
- 11730 Stonewall Springs Ave
- 11672 Barga Ct
- 11741 Stonewall Springs Ave
- 213 Villa Borghese St
- 11815 Corenzio Ave
- 225 Robledo St
- 281 Gandara St
- 11813 Pippa Ave
- 11826 Corenzio Ave
- 238 Little Haystack Dr
- 11834 Albissola Ave
- 11849 Saverio Ave
- 88 Chapman Heights St Unit 3
- 80 Chapman Heights St Unit 3
- 77 Alerion St Unit 2
- 76 Chapman Heights St
- 73 Alerion St
- 85 Chapman Heights St
- 81 Chapman Heights St
- 11608 Cameo Ave
- 68 Chapman Heights St Unit 5
- 69 Alerion St Unit 4
- 73 Chapman Heights St
- 65 Alerion St
- 69 Chapman Heights St Unit 5
- 11601 Cameo Ave
- 76 Alerion St Unit 4
- 64 Chapman Heights St
- 80 Alerion St
- 11612 Cameo Ave
- 11628 La Mirago Place Unit 3
- 84 Alerion St Unit 2