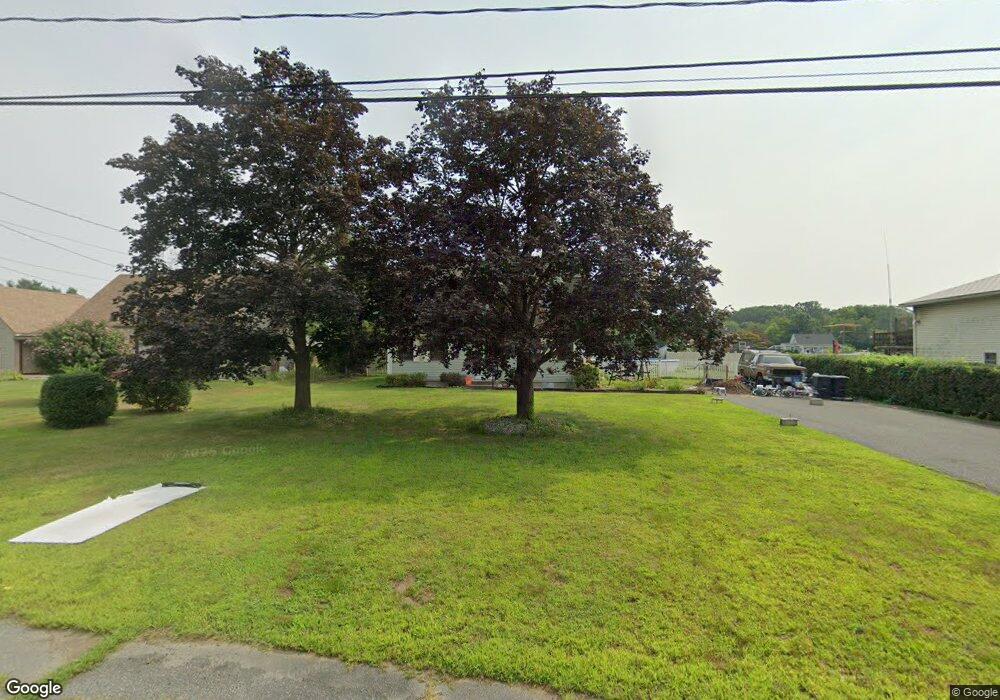
84 Clark St Ludlow, MA 01056
Estimated Value: $402,000 - $488,000
5
Beds
3
Baths
2,067
Sq Ft
$212/Sq Ft
Est. Value
About This Home
This home is located at 84 Clark St, Ludlow, MA 01056 and is currently estimated at $439,216, approximately $212 per square foot. 84 Clark St is a home located in Hampden County with nearby schools including East Street Elementary School, Chapin Street Elementary School, and Paul R. Baird Middle School.
Ownership History
Date
Name
Owned For
Owner Type
Purchase Details
Closed on
Jan 12, 2018
Sold by
Rickson Robert F and Rickson Dianne R
Bought by
Grimshaw Kristopher and Grimshaw Deanna
Current Estimated Value
Home Financials for this Owner
Home Financials are based on the most recent Mortgage that was taken out on this home.
Original Mortgage
$225,000
Outstanding Balance
$188,788
Interest Rate
3.9%
Mortgage Type
VA
Estimated Equity
$250,428
Create a Home Valuation Report for This Property
The Home Valuation Report is an in-depth analysis detailing your home's value as well as a comparison with similar homes in the area
Home Values in the Area
Average Home Value in this Area
Purchase History
| Date | Buyer | Sale Price | Title Company |
|---|---|---|---|
| Grimshaw Kristopher | $225,000 | -- | |
| Grimshaw Kristopher | $225,000 | -- |
Source: Public Records
Mortgage History
| Date | Status | Borrower | Loan Amount |
|---|---|---|---|
| Open | Grimshaw Kristopher | $225,000 | |
| Closed | Grimshaw Kristopher | $225,000 |
Source: Public Records
Tax History Compared to Growth
Tax History
| Year | Tax Paid | Tax Assessment Tax Assessment Total Assessment is a certain percentage of the fair market value that is determined by local assessors to be the total taxable value of land and additions on the property. | Land | Improvement |
|---|---|---|---|---|
| 2025 | $5,684 | $327,600 | $78,800 | $248,800 |
| 2024 | $5,456 | $301,600 | $80,200 | $221,400 |
| 2023 | $5,233 | $268,200 | $66,600 | $201,600 |
| 2022 | $4,934 | $246,800 | $66,600 | $180,200 |
| 2021 | $4,958 | $235,200 | $66,600 | $168,600 |
| 2020 | $4,745 | $230,100 | $65,600 | $164,500 |
| 2019 | $4,505 | $227,300 | $65,000 | $162,300 |
| 2018 | $4,203 | $221,100 | $65,000 | $156,100 |
| 2017 | $4,128 | $222,800 | $66,200 | $156,600 |
| 2016 | $4,005 | $220,900 | $64,900 | $156,000 |
| 2015 | $3,787 | $219,000 | $64,200 | $154,800 |
Source: Public Records
Map
Nearby Homes