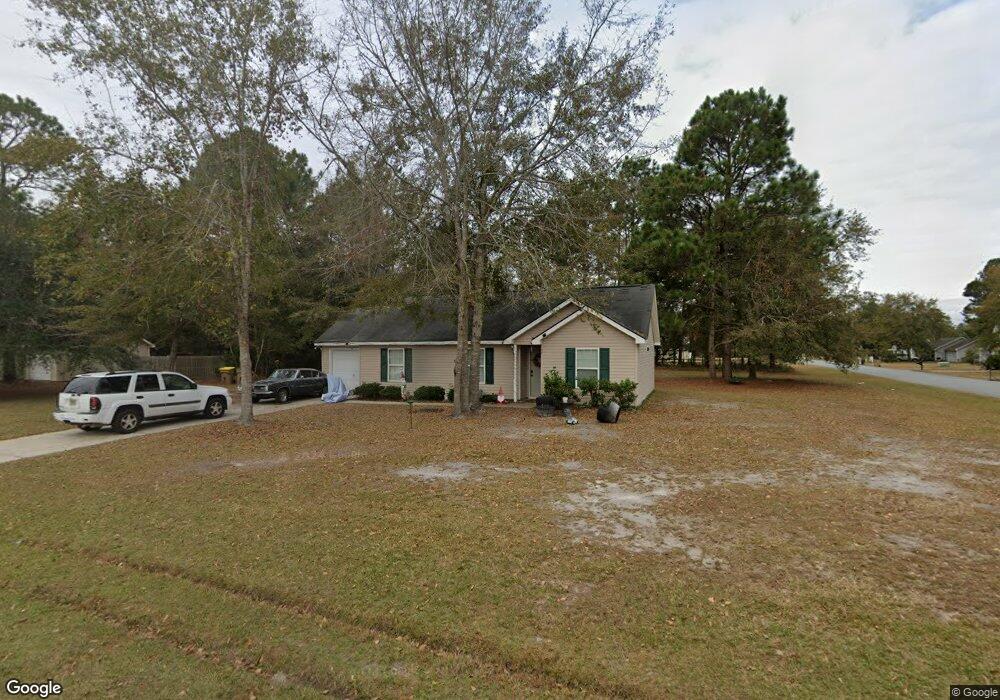
84 Dailey Dr Unit 124 Guyton, GA 31312
Estimated Value: $256,000 - $287,000
3
Beds
2
Baths
1,131
Sq Ft
$240/Sq Ft
Est. Value
About This Home
This home is located at 84 Dailey Dr Unit 124, Guyton, GA 31312 and is currently estimated at $271,673, approximately $240 per square foot. 84 Dailey Dr Unit 124 is a home located in Effingham County with nearby schools including Guyton Elementary School, Effingham County Middle School, and Effingham County High School.
Ownership History
Date
Name
Owned For
Owner Type
Purchase Details
Closed on
Dec 1, 2025
Sold by
Crowe Scott Alan
Bought by
Laplaunt Cindy C and Laplaunt Kenneth J
Current Estimated Value
Home Financials for this Owner
Home Financials are based on the most recent Mortgage that was taken out on this home.
Original Mortgage
$256,849
Outstanding Balance
$256,583
Interest Rate
6.17%
Mortgage Type
Purchase Money Mortgage
Estimated Equity
$15,090
Purchase Details
Closed on
Aug 5, 2024
Sold by
Laplaunt Cindy C
Bought by
Crowe Scott Alan and Jentzen Christiana Lee
Purchase Details
Closed on
Aug 19, 2015
Sold by
Duebler Donald J
Bought by
Gwaltney Susan P
Purchase Details
Closed on
Aug 9, 2013
Sold by
Georgia Housing & Financ
Bought by
Deubler Donald J
Purchase Details
Closed on
May 1, 2012
Sold by
Tyler Michael J
Bought by
Georgia Housing & Finance Au
Purchase Details
Closed on
Dec 12, 2005
Sold by
Mike Stewart Construction
Bought by
Tyler Michael J and Blalock Allison L
Home Financials for this Owner
Home Financials are based on the most recent Mortgage that was taken out on this home.
Original Mortgage
$124,946
Interest Rate
6.28%
Mortgage Type
New Conventional
Create a Home Valuation Report for This Property
The Home Valuation Report is an in-depth analysis detailing your home's value as well as a comparison with similar homes in the area
Home Values in the Area
Average Home Value in this Area
Purchase History
| Date | Buyer | Sale Price | Title Company |
|---|---|---|---|
| Laplaunt Cindy C | -- | -- | |
| Crowe Scott Alan | $240,000 | -- | |
| Laplaunt Cindy C | $240,000 | -- | |
| Gwaltney Susan P | $94,000 | -- | |
| Deubler Donald J | $67,000 | -- | |
| Georgia Housing & Finance Au | $120,098 | -- | |
| Tyler Michael J | $120,300 | -- |
Source: Public Records
Mortgage History
| Date | Status | Borrower | Loan Amount |
|---|---|---|---|
| Open | Laplaunt Cindy C | $256,849 | |
| Previous Owner | Tyler Michael J | $124,946 |
Source: Public Records
Tax History
| Year | Tax Paid | Tax Assessment Tax Assessment Total Assessment is a certain percentage of the fair market value that is determined by local assessors to be the total taxable value of land and additions on the property. | Land | Improvement |
|---|---|---|---|---|
| 2025 | $2,853 | $102,516 | $22,800 | $79,716 |
| 2024 | $2,853 | $95,063 | $22,800 | $72,263 |
| 2023 | $2,340 | $68,986 | $17,600 | $51,386 |
| 2022 | $136 | $58,260 | $14,800 | $43,460 |
| 2021 | $1,847 | $52,198 | $14,000 | $38,198 |
| 2020 | $1,799 | $51,270 | $12,000 | $39,270 |
| 2019 | $1,598 | $44,124 | $10,760 | $33,364 |
| 2018 | $1,541 | $41,803 | $10,760 | $31,043 |
| 2017 | $1,549 | $41,803 | $10,760 | $31,043 |
| 2016 | $1,537 | $43,560 | $10,000 | $33,560 |
| 2015 | -- | $33,257 | $2,400 | $30,857 |
| 2014 | -- | $32,905 | $2,048 | $30,857 |
| 2013 | -- | $35,977 | $5,120 | $30,857 |
Source: Public Records
Map
Nearby Homes
- 296 Barrister Cir
- 278 Barrister Cir
- 103 Benicia Ln
- 115 Indica Place
- 235 Southern Charm Way
- 520 Glory Dr
- 121 Benicia Ln
- 321 Saranac Way
- 102 Serenoa Dr
- 114 Serenoa Dr
- 101 Serenoa Dr
- 108 Stonesthrow Ct
- 404 Sir Arthur Ct
- 99 Conifer Dr
- 228 Wild Rose Dr
- 119 Hunters Chase Dr Unit Lot 62
- 119 Hunters Chase Dr
- 268 Appaloosa Way
- 121 Hunters Chase Dr
- 121 Hunters Chase Dr Unit Lot 61
- 84 Dailey Dr Unit .3
- 84 Daily Dr
- 84 Dailey Dr
- 86 Dailey Dr
- 189 Walker Dr
- 191 Walker Dr
- 279 Barrister Cir
- 88 Dailey Dr
- 89 Dailey Dr
- 283 Barrister Cir
- 277 Barrister Cir
- 193 Walker Dr
- 275 Barrister Cir
- 0 Barrister Cir Unit 61553
- 0 Barrister Cr Unit 64307
- 90 Dailey Dr
- 91 Dailey Dr
- 195 Walker Dr
- 273 Barrister Cir
- 288 Barrister Cir
Your Personal Tour Guide
Ask me questions while you tour the home.