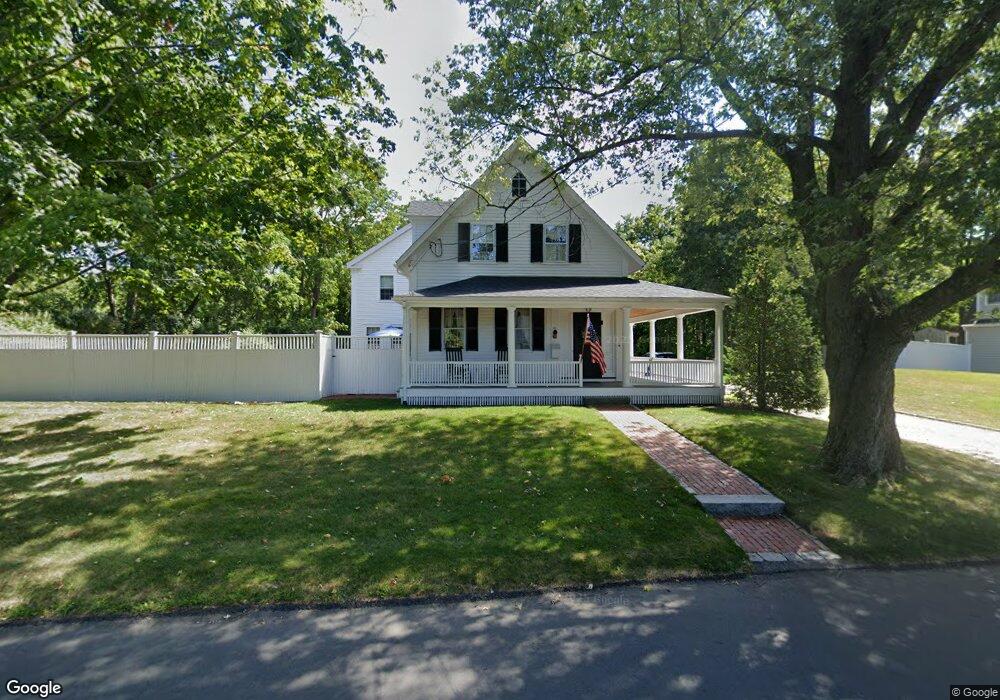
84 Elm St Hingham, MA 02043
Estimated Value: $1,457,000 - $1,859,000
7
Beds
3
Baths
2,810
Sq Ft
$583/Sq Ft
Est. Value
About This Home
This home is located at 84 Elm St, Hingham, MA 02043 and is currently estimated at $1,637,009, approximately $582 per square foot. 84 Elm St is a home located in Plymouth County with nearby schools including William L. Foster Elementary School, Hingham Middle School, and Hingham High School.
Ownership History
Date
Name
Owned For
Owner Type
Purchase Details
Closed on
Dec 16, 1993
Sold by
Elm St Rt and Melia Arthur J
Bought by
Hughes Michelle G and Hughes Stephen J
Current Estimated Value
Home Financials for this Owner
Home Financials are based on the most recent Mortgage that was taken out on this home.
Original Mortgage
$172,000
Interest Rate
7.03%
Mortgage Type
Purchase Money Mortgage
Create a Home Valuation Report for This Property
The Home Valuation Report is an in-depth analysis detailing your home's value as well as a comparison with similar homes in the area
Purchase History
| Date | Buyer | Sale Price | Title Company |
|---|---|---|---|
| Hughes Michelle G | $215,000 | -- |
Source: Public Records
Mortgage History
| Date | Status | Borrower | Loan Amount |
|---|---|---|---|
| Open | Hughes Michelle G | $500,000 | |
| Closed | Hughes Michelle G | $220,000 | |
| Closed | Hughes Michelle G | $70,000 | |
| Closed | Hughes Michelle G | $172,000 |
Source: Public Records
Tax History
| Year | Tax Paid | Tax Assessment Tax Assessment Total Assessment is a certain percentage of the fair market value that is determined by local assessors to be the total taxable value of land and additions on the property. | Land | Improvement |
|---|---|---|---|---|
| 2025 | $13,840 | $1,294,700 | $763,000 | $531,700 |
| 2024 | $13,925 | $1,283,400 | $763,000 | $520,400 |
| 2023 | $12,674 | $1,267,400 | $763,000 | $504,400 |
| 2022 | $12,409 | $1,073,400 | $657,600 | $415,800 |
| 2021 | $12,479 | $1,057,500 | $657,600 | $399,900 |
| 2020 | $8,164 | $1,057,500 | $657,600 | $399,900 |
| 2019 | $11,522 | $975,600 | $548,000 | $427,600 |
| 2018 | $11,298 | $959,900 | $548,000 | $411,900 |
| 2017 | $11,292 | $921,800 | $548,000 | $373,800 |
| 2016 | $11,110 | $889,500 | $521,800 | $367,700 |
| 2015 | $10,637 | $848,900 | $496,500 | $352,400 |
Source: Public Records
Map
Nearby Homes
- 7 Lewis Ct
- 19 Lantern Ln
- 21 Hersey St
- 225 South St Unit 1
- 6 Leavitt St
- 428 Main St
- 6 Adams Ct
- 168 Stayner Dr Unit 168
- 14 Spring St
- 6 Brewer Way
- 10 Colby Rd
- 29 Chief Justice Cushing Hwy
- 65 East St
- 156 Fort Hill St
- 82 East St
- 9 Barnes Rd
- 1 Squirrel Hill Ln
- 34 Otis Hill Rd
- 43 Park View Dr
- 2 Woodbine Ln
Your Personal Tour Guide
Ask me questions while you tour the home.