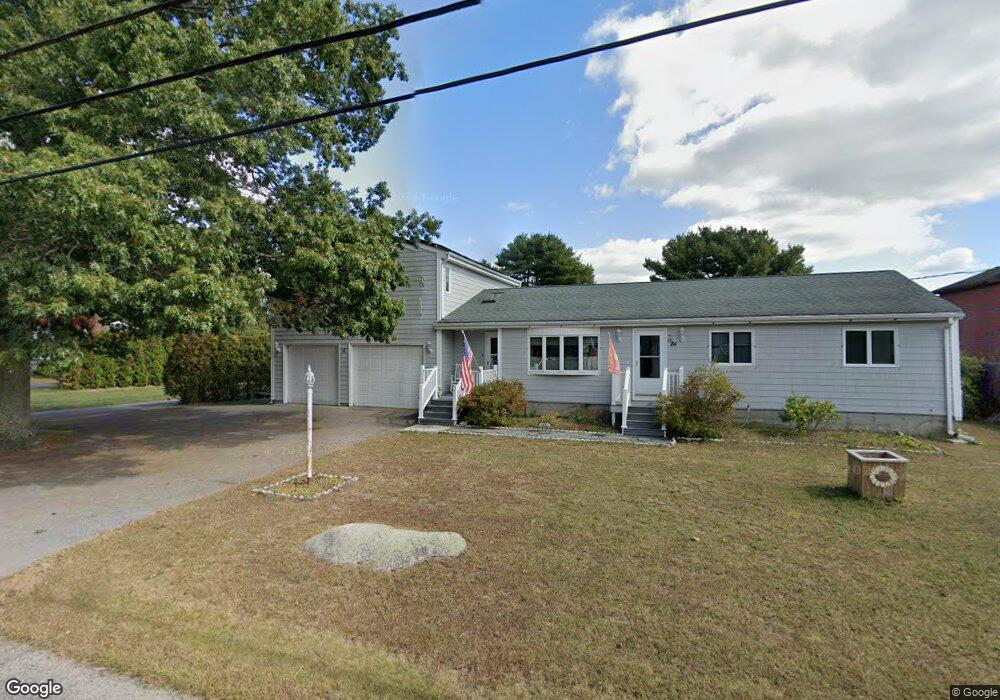
84 Forge Rd Westport, MA 02790
North Westport NeighborhoodEstimated Value: $513,000 - $688,000
3
Beds
--
Bath
1,889
Sq Ft
$305/Sq Ft
Est. Value
About This Home
This home is located at 84 Forge Rd, Westport, MA 02790 and is currently estimated at $576,874, approximately $305 per square foot. 84 Forge Rd is a home located in Bristol County with nearby schools including Alice A. Macomber Primary School, Westport Elementary School, and Westport Middle-High School.
Ownership History
Date
Name
Owned For
Owner Type
Purchase Details
Closed on
Oct 25, 2021
Sold by
Platt William H
Bought by
Platt William H and Platt Tina M
Current Estimated Value
Purchase Details
Closed on
May 12, 2020
Sold by
Platt William H
Bought by
Platt William H
Home Financials for this Owner
Home Financials are based on the most recent Mortgage that was taken out on this home.
Original Mortgage
$220,000
Interest Rate
3.5%
Mortgage Type
New Conventional
Purchase Details
Closed on
Sep 18, 2018
Sold by
Platt Julia T and Platt William H
Bought by
Platt William H
Purchase Details
Closed on
Jun 26, 1970
Bought by
Platt William H and Platt Julia T
Create a Home Valuation Report for This Property
The Home Valuation Report is an in-depth analysis detailing your home's value as well as a comparison with similar homes in the area
Home Values in the Area
Average Home Value in this Area
Purchase History
| Date | Buyer | Sale Price | Title Company |
|---|---|---|---|
| Platt William H | -- | None Available | |
| Platt William H | $275,000 | None Available | |
| Platt William H | -- | -- | |
| Platt William H | -- | -- |
Source: Public Records
Mortgage History
| Date | Status | Borrower | Loan Amount |
|---|---|---|---|
| Previous Owner | Platt William H | $220,000 | |
| Previous Owner | Platt William H | $166,852 | |
| Previous Owner | Platt William H | $132,071 |
Source: Public Records
Tax History
| Year | Tax Paid | Tax Assessment Tax Assessment Total Assessment is a certain percentage of the fair market value that is determined by local assessors to be the total taxable value of land and additions on the property. | Land | Improvement |
|---|---|---|---|---|
| 2025 | $3,604 | $483,800 | $147,700 | $336,100 |
| 2024 | $3,362 | $434,900 | $136,900 | $298,000 |
| 2023 | $3,129 | $383,500 | $124,200 | $259,300 |
| 2022 | $2,756 | $338,700 | $117,900 | $220,800 |
| 2021 | $2,756 | $319,700 | $107,200 | $212,500 |
| 2020 | $2,613 | $310,000 | $97,500 | $212,500 |
| 2019 | $2,531 | $306,100 | $97,500 | $208,600 |
| 2018 | $2,214 | $271,000 | $109,600 | $161,400 |
| 2017 | $2,106 | $264,200 | $106,100 | $158,100 |
| 2016 | $1,996 | $252,300 | $102,600 | $149,700 |
| 2015 | $1,890 | $238,300 | $104,900 | $133,400 |
Source: Public Records
Map
Nearby Homes
- 2 Winterberry Ln
- 3 Roller Coaster Way Unit Lot 1
- 2 Fieldstone Dr
- 162 Reed Rd
- 588 Gifford Rd
- 15 S Breault St
- 21 Evergreen St
- 818 Reed Rd
- 0 American Legion Hwy Unit 73473517
- 565 Highland Ave
- 441 Old County Rd
- 16 Lenox Ave
- 2 Van Buren St
- 13 3rd Ave
- 4 Main Rd
- 116 Gifford Rd
- 0 Hertitage Acres
- 19 Charles Joseph Dr
- 45 Marcotte Unit Lot 7
- 11 Marcotte Dr Unit Lot 2
Your Personal Tour Guide
Ask me questions while you tour the home.