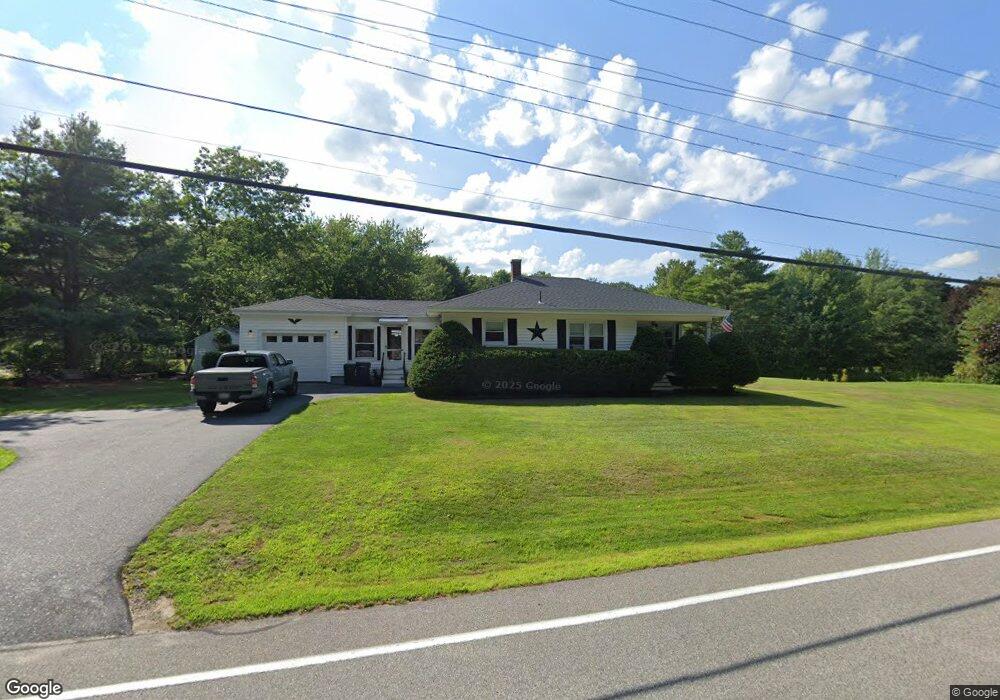
84 Guinea Rd Biddeford, ME 04005
South Biddeford NeighborhoodEstimated Value: $375,000 - $453,000
2
Beds
2
Baths
1,052
Sq Ft
$382/Sq Ft
Est. Value
About This Home
This home is located at 84 Guinea Rd, Biddeford, ME 04005 and is currently estimated at $402,376, approximately $382 per square foot. 84 Guinea Rd is a home located in York County with nearby schools including John F Kennedy Memorial School, Biddeford Primary School, and Biddeford Intermediate School.
Ownership History
Date
Name
Owned For
Owner Type
Purchase Details
Closed on
May 1, 2019
Sold by
Morn Rita F Est
Bought by
Paul Christopher A
Current Estimated Value
Home Financials for this Owner
Home Financials are based on the most recent Mortgage that was taken out on this home.
Original Mortgage
$193,500
Outstanding Balance
$170,126
Interest Rate
4.2%
Mortgage Type
New Conventional
Estimated Equity
$232,250
Create a Home Valuation Report for This Property
The Home Valuation Report is an in-depth analysis detailing your home's value as well as a comparison with similar homes in the area
Home Values in the Area
Average Home Value in this Area
Purchase History
| Date | Buyer | Sale Price | Title Company |
|---|---|---|---|
| Paul Christopher A | -- | -- |
Source: Public Records
Mortgage History
| Date | Status | Borrower | Loan Amount |
|---|---|---|---|
| Open | Paul Christopher A | $193,500 |
Source: Public Records
Tax History
| Year | Tax Paid | Tax Assessment Tax Assessment Total Assessment is a certain percentage of the fair market value that is determined by local assessors to be the total taxable value of land and additions on the property. | Land | Improvement |
|---|---|---|---|---|
| 2024 | $4,354 | $306,200 | $155,200 | $151,000 |
| 2023 | $4,017 | $306,200 | $155,200 | $151,000 |
| 2022 | $3,860 | $235,200 | $84,500 | $150,700 |
| 2021 | $3,630 | $199,100 | $70,400 | $128,700 |
| 2020 | $3,573 | $178,200 | $59,800 | $118,400 |
| 2019 | $3,518 | $176,100 | $59,800 | $116,300 |
| 2018 | $3,469 | $176,100 | $59,800 | $116,300 |
| 2017 | $3,223 | $160,600 | $59,800 | $100,800 |
| 2016 | $3,190 | $160,600 | $59,800 | $100,800 |
| 2015 | $2,815 | $160,600 | $59,800 | $100,800 |
| 2014 | $2,746 | $160,600 | $59,800 | $100,800 |
| 2013 | -- | $165,400 | $55,800 | $109,600 |
Source: Public Records
Map
Nearby Homes