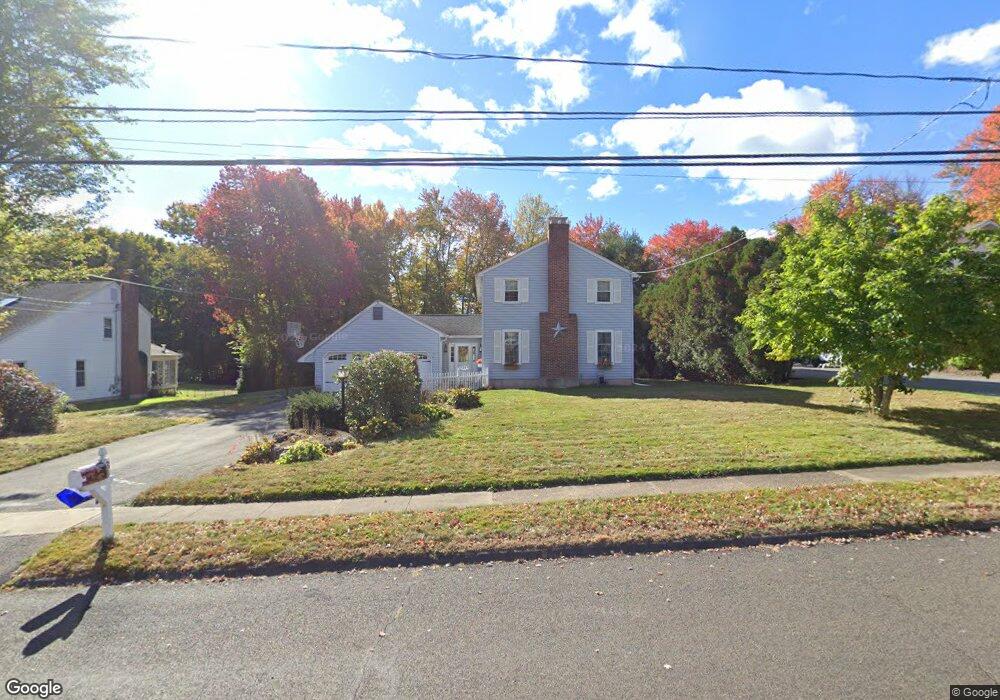
84 Hightower Rd Southington, CT 06489
West Southington NeighborhoodEstimated Value: $521,838 - $572,000
4
Beds
3
Baths
1,944
Sq Ft
$280/Sq Ft
Est. Value
About This Home
This home is located at 84 Hightower Rd, Southington, CT 06489 and is currently estimated at $543,710, approximately $279 per square foot. 84 Hightower Rd is a home located in Hartford County with nearby schools including Urbin T. Kelley Elementary School, Joseph A. Depaolo Middle School, and Southington High School.
Ownership History
Date
Name
Owned For
Owner Type
Purchase Details
Closed on
Feb 5, 2007
Sold by
Larter Kevin C and Larter Virginia A
Bought by
Snow Christopher D and Snow Rachel A
Current Estimated Value
Home Financials for this Owner
Home Financials are based on the most recent Mortgage that was taken out on this home.
Original Mortgage
$319,500
Outstanding Balance
$115,946
Interest Rate
6.16%
Estimated Equity
$427,764
Purchase Details
Closed on
Nov 29, 2004
Sold by
Sowa Alexander P and Sowa Kathleen A
Bought by
Larter Kevin C and Larter Virginia A
Home Financials for this Owner
Home Financials are based on the most recent Mortgage that was taken out on this home.
Original Mortgage
$260,000
Interest Rate
3.87%
Purchase Details
Closed on
May 11, 1990
Sold by
Krause Barbara
Bought by
Rocheleau Paul
Create a Home Valuation Report for This Property
The Home Valuation Report is an in-depth analysis detailing your home's value as well as a comparison with similar homes in the area
Home Values in the Area
Average Home Value in this Area
Purchase History
| Date | Buyer | Sale Price | Title Company |
|---|---|---|---|
| Snow Christopher D | $355,000 | -- | |
| Larter Kevin C | $325,000 | -- | |
| Rocheleau Paul | $208,000 | -- |
Source: Public Records
Mortgage History
| Date | Status | Borrower | Loan Amount |
|---|---|---|---|
| Open | Rocheleau Paul | $319,500 | |
| Previous Owner | Rocheleau Paul | $260,000 | |
| Previous Owner | Rocheleau Paul | $209,000 | |
| Previous Owner | Rocheleau Paul | $168,000 |
Source: Public Records
Tax History Compared to Growth
Tax History
| Year | Tax Paid | Tax Assessment Tax Assessment Total Assessment is a certain percentage of the fair market value that is determined by local assessors to be the total taxable value of land and additions on the property. | Land | Improvement |
|---|---|---|---|---|
| 2025 | $7,237 | $217,910 | $71,810 | $146,100 |
| 2024 | $6,851 | $217,910 | $71,810 | $146,100 |
| 2023 | $6,616 | $217,910 | $71,810 | $146,100 |
| 2022 | $6,348 | $217,910 | $71,810 | $146,100 |
| 2021 | $6,276 | $216,180 | $71,810 | $144,370 |
| 2020 | $6,385 | $208,460 | $73,280 | $135,180 |
| 2019 | $6,371 | $207,940 | $73,280 | $134,660 |
| 2018 | $6,338 | $207,940 | $73,280 | $134,660 |
| 2017 | $6,338 | $207,940 | $73,280 | $134,660 |
| 2016 | $6,163 | $207,940 | $73,280 | $134,660 |
| 2015 | $5,996 | $205,780 | $69,780 | $136,000 |
| 2014 | $5,836 | $205,780 | $69,780 | $136,000 |
Source: Public Records
Map
Nearby Homes