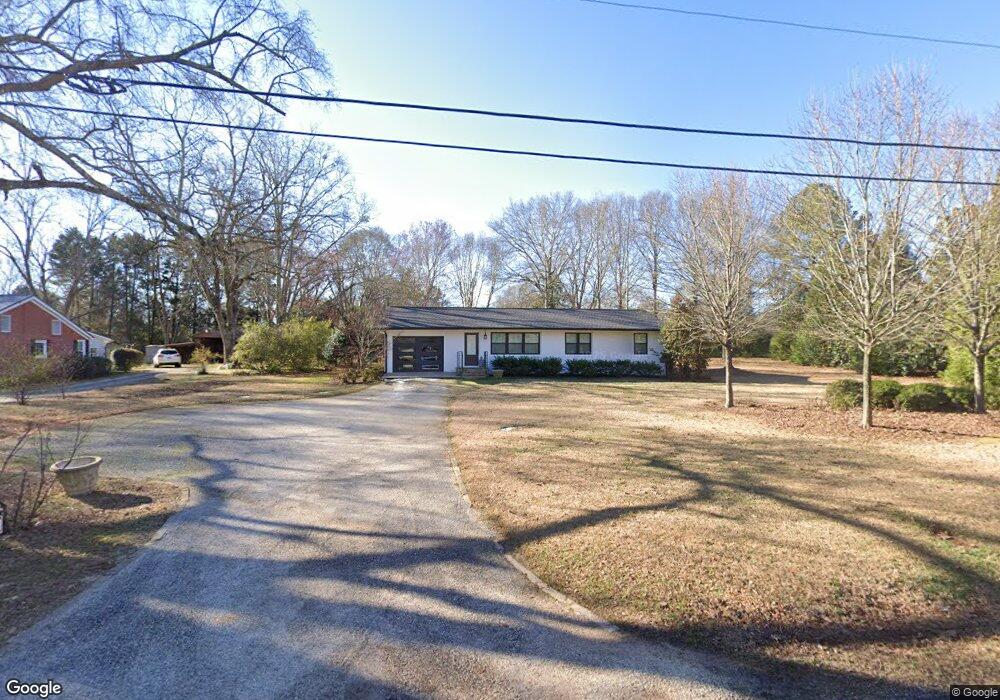
84 Jackson St Watkinsville, GA 30677
Estimated Value: $455,000 - $613,375
--
Bed
--
Bath
2,224
Sq Ft
$241/Sq Ft
Est. Value
About This Home
This home is located at 84 Jackson St, Watkinsville, GA 30677 and is currently estimated at $537,094, approximately $241 per square foot. 84 Jackson St is a home located in Oconee County with nearby schools including Colham Ferry Elementary School, Oconee County Middle School, and Oconee County High School.
Ownership History
Date
Name
Owned For
Owner Type
Purchase Details
Closed on
May 10, 2019
Sold by
Grahl Lindsay M
Bought by
Walker Terry T
Current Estimated Value
Purchase Details
Closed on
Sep 2, 2015
Sold by
Precise Landscape & Design
Bought by
Mcclure Lindsay Kay
Purchase Details
Closed on
Jul 14, 2014
Sold by
Mcclure Ian
Bought by
Precise Landscape & Design Inc
Home Financials for this Owner
Home Financials are based on the most recent Mortgage that was taken out on this home.
Original Mortgage
$137,000
Interest Rate
4.26%
Mortgage Type
New Conventional
Purchase Details
Closed on
Jul 16, 2009
Sold by
Alewine Shirley
Bought by
Mclure Ian
Home Financials for this Owner
Home Financials are based on the most recent Mortgage that was taken out on this home.
Original Mortgage
$152,000
Interest Rate
5.37%
Mortgage Type
New Conventional
Create a Home Valuation Report for This Property
The Home Valuation Report is an in-depth analysis detailing your home's value as well as a comparison with similar homes in the area
Home Values in the Area
Average Home Value in this Area
Purchase History
| Date | Buyer | Sale Price | Title Company |
|---|---|---|---|
| Walker Terry T | $209,000 | -- | |
| Mcclure Lindsay Kay | -- | -- | |
| Precise Landscape & Design Inc | -- | -- | |
| Mclure Ian | $162,000 | -- |
Source: Public Records
Mortgage History
| Date | Status | Borrower | Loan Amount |
|---|---|---|---|
| Previous Owner | Precise Landscape & Design Inc | $137,000 | |
| Previous Owner | Mclure Ian | $152,000 |
Source: Public Records
Tax History Compared to Growth
Tax History
| Year | Tax Paid | Tax Assessment Tax Assessment Total Assessment is a certain percentage of the fair market value that is determined by local assessors to be the total taxable value of land and additions on the property. | Land | Improvement |
|---|---|---|---|---|
| 2024 | $4,642 | $205,812 | $34,000 | $171,812 |
| 2023 | $4,606 | $193,170 | $34,000 | $159,170 |
| 2022 | $4,151 | $170,245 | $34,000 | $136,245 |
| 2021 | $3,498 | $133,644 | $28,000 | $105,644 |
| 2020 | $2,675 | $101,013 | $28,000 | $73,013 |
| 2019 | $1,920 | $72,104 | $28,000 | $44,104 |
| 2018 | $1,633 | $60,121 | $22,000 | $38,121 |
| 2017 | $1,542 | $56,417 | $22,000 | $34,417 |
| 2016 | $1,482 | $53,990 | $20,000 | $33,990 |
| 2015 | $1,439 | $52,234 | $20,000 | $32,234 |
| 2014 | $1,428 | $50,665 | $20,000 | $30,665 |
| 2013 | -- | $49,229 | $20,000 | $29,229 |
Source: Public Records
Map
Nearby Homes
- 96 Morrison St Unit 53
- 92 Morrison St Unit 54
- 90 Morrison St Unit 55
- 96 Morrison St
- 90 Morrison St
- 70, 72 Colham Ferry Extension
- 157 S Main St
- 1345 Harmony Bend
- 1385 Harmony Bend
- 1380 Melody Bend
- Cottage 5 Plan at Trove
- Cottage 6 Plan at Trove
- Cottage 4 Plan at Trove
- Cottage 3 Plan at Trove
- Cottage 2 Plan at Trove
- 1255 Melody Bend
- 1255 Melody Bend Unit 2
- 1075 Harmony Bend Unit LOT 24
- 100 Morrison St
- 100 Morrison St Unit 52
- 76 Jackson St
- 90 Harden Hill Rd
- 85 Harden Hill Rd
- 77 Jackson St
- 79 Harden Hill Rd
- 73 Jackson St
- 72 Jackson St
- 71 Jackson St
- 0 Harden Hill Rd Unit 7088655
- 0 Harden Hill Rd Unit 8304026
- 0 Harden Hill Rd Unit 7139578
- 0 Harden Hill Rd Unit 9028984
- 0 Harden Hill Rd Unit 9053741
- 0 Harden Hill Rd Unit 9076014
- 49 Whitehead Dr
- 67 Jackson St
- 70 Harden Hill Rd
- 68 Jackson St
- 97 Harden Hill Rd
- 54 Whitehead Dr