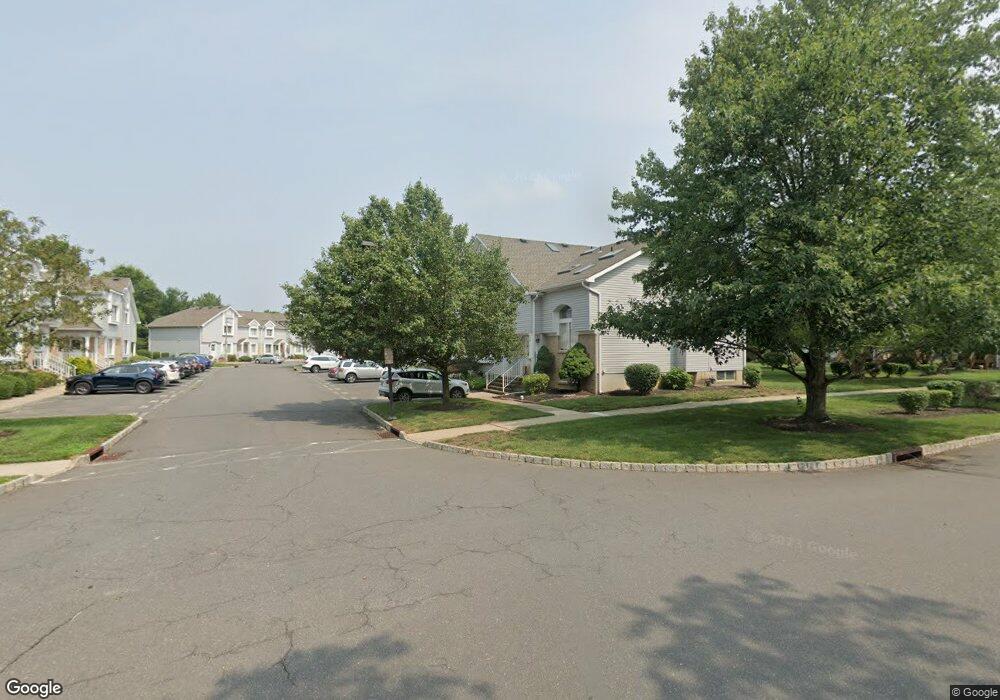
84 Joann Ct Monmouth Junction, NJ 08852
Estimated Value: $529,776 - $561,000
--
Bed
--
Bath
1,529
Sq Ft
$361/Sq Ft
Est. Value
About This Home
This home is located at 84 Joann Ct, Monmouth Junction, NJ 08852 and is currently estimated at $551,444, approximately $360 per square foot. 84 Joann Ct is a home located in Middlesex County with nearby schools including Brooks Crossing Elementary School, Crossroads North Middle School, and South Brunswick High School.
Ownership History
Date
Name
Owned For
Owner Type
Purchase Details
Closed on
Mar 26, 2021
Sold by
Harrington Charlene Carol and Estate Of Carolyn E Condron
Bought by
Sahu Sudam and Sahu Santosini
Current Estimated Value
Home Financials for this Owner
Home Financials are based on the most recent Mortgage that was taken out on this home.
Original Mortgage
$349,600
Outstanding Balance
$315,137
Interest Rate
2.9%
Mortgage Type
New Conventional
Estimated Equity
$236,307
Purchase Details
Closed on
Jun 28, 1991
Bought by
Condron John R and Condron Carolyn C
Create a Home Valuation Report for This Property
The Home Valuation Report is an in-depth analysis detailing your home's value as well as a comparison with similar homes in the area
Home Values in the Area
Average Home Value in this Area
Purchase History
| Date | Buyer | Sale Price | Title Company |
|---|---|---|---|
| Sahu Sudam | $373,000 | East Coast Title Agency | |
| Condron John R | $130,000 | -- |
Source: Public Records
Mortgage History
| Date | Status | Borrower | Loan Amount |
|---|---|---|---|
| Open | Sahu Sudam | $349,600 |
Source: Public Records
Tax History Compared to Growth
Tax History
| Year | Tax Paid | Tax Assessment Tax Assessment Total Assessment is a certain percentage of the fair market value that is determined by local assessors to be the total taxable value of land and additions on the property. | Land | Improvement |
|---|---|---|---|---|
| 2025 | $8,060 | $149,200 | $50,000 | $99,200 |
| 2024 | $7,770 | $149,200 | $50,000 | $99,200 |
| 2023 | $7,770 | $149,200 | $50,000 | $99,200 |
| 2022 | $7,539 | $149,200 | $50,000 | $99,200 |
| 2021 | $5,250 | $135,000 | $50,000 | $85,000 |
| 2020 | $6,863 | $135,000 | $50,000 | $85,000 |
| 2019 | $6,926 | $135,000 | $50,000 | $85,000 |
| 2018 | $6,699 | $135,000 | $50,000 | $85,000 |
| 2017 | $6,689 | $135,000 | $50,000 | $85,000 |
| 2016 | $6,619 | $135,000 | $50,000 | $85,000 |
| 2015 | $6,417 | $135,000 | $50,000 | $85,000 |
| 2014 | $6,313 | $135,000 | $50,000 | $85,000 |
Source: Public Records
Map
Nearby Homes
- 8 Marc Dr
- 586 Ridge Rd
- 45 Hannah Dr
- 45 Old New Rd
- 3 Hannah Dr
- 30 Magnolia Ct
- 32 Magnolia Ct
- 22 Witch Hazel Ct Unit 2
- 10-Q Dayton Cir
- Q10 Quincy Cir Unit Q-10
- G8 Quincy Cir Unit G
- 8 Quincy Cir Unit G
- 9 Kearns Place Unit 3805
- 21 Regal Dr
- 147 Major Rd
- 4 Lincoln Ln Unit F4
- 48 Woodland Way
- 4 Drinking Brook Rd
- 209 Gambocz Ct
- 4 Donner Ct