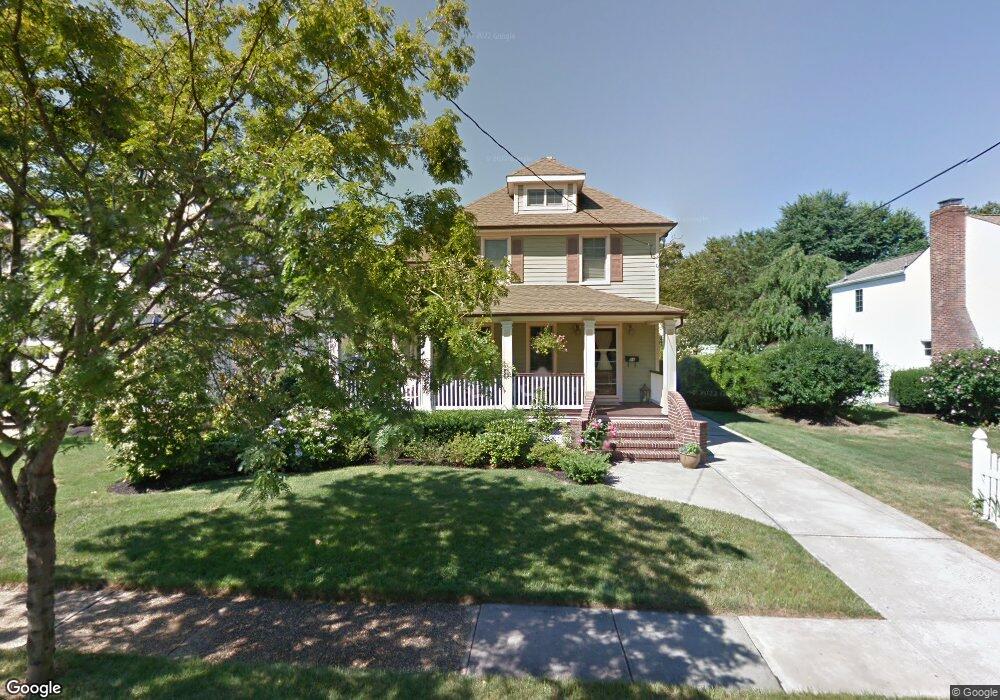
84 Lafayette St Rumson, NJ 07760
Estimated Value: $1,161,000 - $1,509,000
3
Beds
3
Baths
1,852
Sq Ft
$694/Sq Ft
Est. Value
About This Home
This home is located at 84 Lafayette St, Rumson, NJ 07760 and is currently estimated at $1,284,671, approximately $693 per square foot. 84 Lafayette St is a home located in Monmouth County with nearby schools including Deane Porter School, Forrestdale School, and Rumson Fair Haven Regional High School.
Ownership History
Date
Name
Owned For
Owner Type
Purchase Details
Closed on
Oct 31, 2006
Sold by
Little Silver Investors Llc
Bought by
Dickson Peter
Current Estimated Value
Home Financials for this Owner
Home Financials are based on the most recent Mortgage that was taken out on this home.
Original Mortgage
$200,000
Outstanding Balance
$118,965
Interest Rate
6.31%
Mortgage Type
New Conventional
Estimated Equity
$1,165,706
Purchase Details
Closed on
Oct 4, 2005
Sold by
Shires William
Bought by
Little Silver Investors Llc
Create a Home Valuation Report for This Property
The Home Valuation Report is an in-depth analysis detailing your home's value as well as a comparison with similar homes in the area
Home Values in the Area
Average Home Value in this Area
Purchase History
| Date | Buyer | Sale Price | Title Company |
|---|---|---|---|
| Dickson Peter | $770,000 | -- | |
| Little Silver Investors Llc | $475,000 | -- |
Source: Public Records
Mortgage History
| Date | Status | Borrower | Loan Amount |
|---|---|---|---|
| Open | Dickson Peter | $200,000 |
Source: Public Records
Tax History
| Year | Tax Paid | Tax Assessment Tax Assessment Total Assessment is a certain percentage of the fair market value that is determined by local assessors to be the total taxable value of land and additions on the property. | Land | Improvement |
|---|---|---|---|---|
| 2025 | $11,235 | $1,102,800 | $767,300 | $335,500 |
| 2024 | $11,289 | $1,021,400 | $716,100 | $305,300 |
| 2023 | $11,289 | $965,700 | $689,000 | $276,700 |
| 2022 | $10,857 | $871,600 | $611,600 | $260,000 |
| 2021 | $10,857 | $763,000 | $528,200 | $234,800 |
| 2020 | $10,143 | $707,800 | $487,000 | $220,800 |
| 2019 | $9,184 | $625,200 | $291,400 | $333,800 |
| 2018 | $9,036 | $609,700 | $291,400 | $318,300 |
| 2017 | $8,400 | $571,800 | $263,200 | $308,600 |
| 2016 | $8,082 | $564,000 | $263,200 | $300,800 |
| 2015 | $7,997 | $550,400 | $263,200 | $287,200 |
| 2014 | $7,837 | $537,900 | $258,500 | $279,400 |
Source: Public Records
Map
Nearby Homes
Your Personal Tour Guide
Ask me questions while you tour the home.