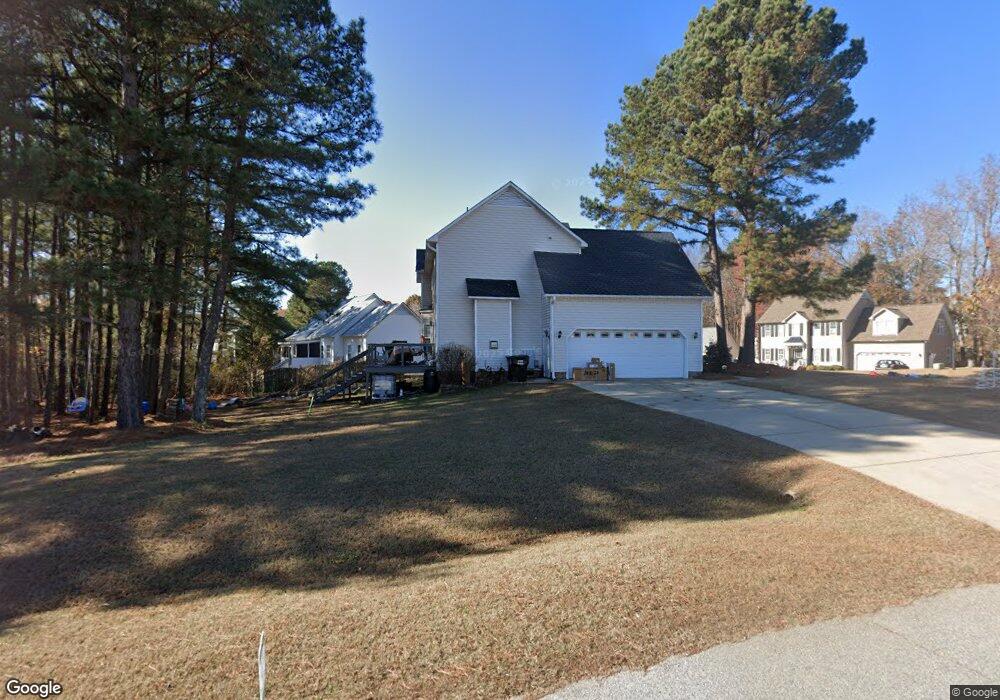
84 Lee Forest Ct Clayton, NC 27520
Community Park NeighborhoodEstimated Value: $388,000 - $438,000
4
Beds
3
Baths
2,272
Sq Ft
$183/Sq Ft
Est. Value
About This Home
This home is located at 84 Lee Forest Ct, Clayton, NC 27520 and is currently estimated at $414,786, approximately $182 per square foot. 84 Lee Forest Ct is a home located in Johnston County with nearby schools including West Clayton Elementary School, Clayton Middle School, and Clayton High.
Ownership History
Date
Name
Owned For
Owner Type
Purchase Details
Closed on
Mar 30, 2017
Sold by
Landahl Brian G and Landahl Laura R
Bought by
Edwards Andrew J and Edwards Deidre
Current Estimated Value
Home Financials for this Owner
Home Financials are based on the most recent Mortgage that was taken out on this home.
Original Mortgage
$177,000
Outstanding Balance
$147,089
Interest Rate
4.16%
Mortgage Type
New Conventional
Estimated Equity
$267,697
Purchase Details
Closed on
Mar 25, 2011
Sold by
Flower Shamus P and Flower Brigette N
Bought by
Landahl Brian G and Landahl Laura R
Home Financials for this Owner
Home Financials are based on the most recent Mortgage that was taken out on this home.
Original Mortgage
$152,250
Interest Rate
4.92%
Mortgage Type
New Conventional
Purchase Details
Closed on
Nov 22, 2005
Sold by
Scott Lee Homes Inc
Bought by
Flower Shamus P and Flower Brigette N
Home Financials for this Owner
Home Financials are based on the most recent Mortgage that was taken out on this home.
Original Mortgage
$30,735
Interest Rate
6.1%
Mortgage Type
Stand Alone Second
Create a Home Valuation Report for This Property
The Home Valuation Report is an in-depth analysis detailing your home's value as well as a comparison with similar homes in the area
Home Values in the Area
Average Home Value in this Area
Purchase History
| Date | Buyer | Sale Price | Title Company |
|---|---|---|---|
| Edwards Andrew J | $232,000 | -- | |
| Landahl Brian G | $203,000 | None Available | |
| Flower Shamus P | $205,000 | None Available |
Source: Public Records
Mortgage History
| Date | Status | Borrower | Loan Amount |
|---|---|---|---|
| Open | Edwards Andrew J | $177,000 | |
| Previous Owner | Landahl Brian G | $152,250 | |
| Previous Owner | Flower Shamus P | $30,735 | |
| Previous Owner | Flower Shamus P | $163,920 |
Source: Public Records
Tax History Compared to Growth
Tax History
| Year | Tax Paid | Tax Assessment Tax Assessment Total Assessment is a certain percentage of the fair market value that is determined by local assessors to be the total taxable value of land and additions on the property. | Land | Improvement |
|---|---|---|---|---|
| 2025 | $2,509 | $395,040 | $95,000 | $300,040 |
| 2024 | $1,802 | $222,420 | $40,000 | $182,420 |
| 2023 | $1,868 | $222,420 | $40,000 | $182,420 |
| 2022 | $1,885 | $222,420 | $40,000 | $182,420 |
| 2021 | $1,885 | $222,420 | $40,000 | $182,420 |
| 2020 | $1,952 | $222,420 | $40,000 | $182,420 |
| 2019 | $1,952 | $222,420 | $40,000 | $182,420 |
| 2018 | $1,756 | $195,690 | $30,000 | $165,690 |
| 2017 | $1,756 | $195,690 | $30,000 | $165,690 |
| 2016 | $1,717 | $195,690 | $30,000 | $165,690 |
| 2015 | $1,373 | $195,690 | $30,000 | $165,690 |
| 2014 | $1,373 | $195,690 | $30,000 | $165,690 |
Source: Public Records
Map
Nearby Homes
- 82 Finley Ct
- 249 Finley Ct
- 2013 Myrtle Ln
- 122 Enterprise Dr
- 2004 Magnolia Ct
- 2579 Valley Dr
- 637 Marrian Dr
- 80 Liam St
- 103 Liam St Unit 108
- 20 Sugarpine Trail
- 315 Sugarpine Trail
- 14 Ct
- 36 Pink Iris Ct
- 37 Pink Iris Ct
- 54 E Fire Opal Ct
- 25 W Fire Opal Ct
- 24 Pink Iris Ct
- 49 W Fire Opal Ct
- 77 Redpine Ct
- 176 Red Jasper Way
- 51 Finley Ct
- 91 Lee Forest Ct
- 108 Lee Forest Ct
- 69 Finley Ct
- 12 Finley Ct
- 32 Finley Ct
- 48 Finley Ct
- 36 Larson Ct
- 117 Lee Forest Ct
- 117 Lee Forest Ct Unit 28
- 57 Keller Dr
- 66 Finley Ct
- 29 Larson Ct
- 113 Lee Forest Ct
- 32 Lee Forest Ct
- 91 Finley Ct
- 52 Larson Ct
- 12 Lee Forest Ct
- 2017 Guy Rd
- 23 Lee Forest Ct