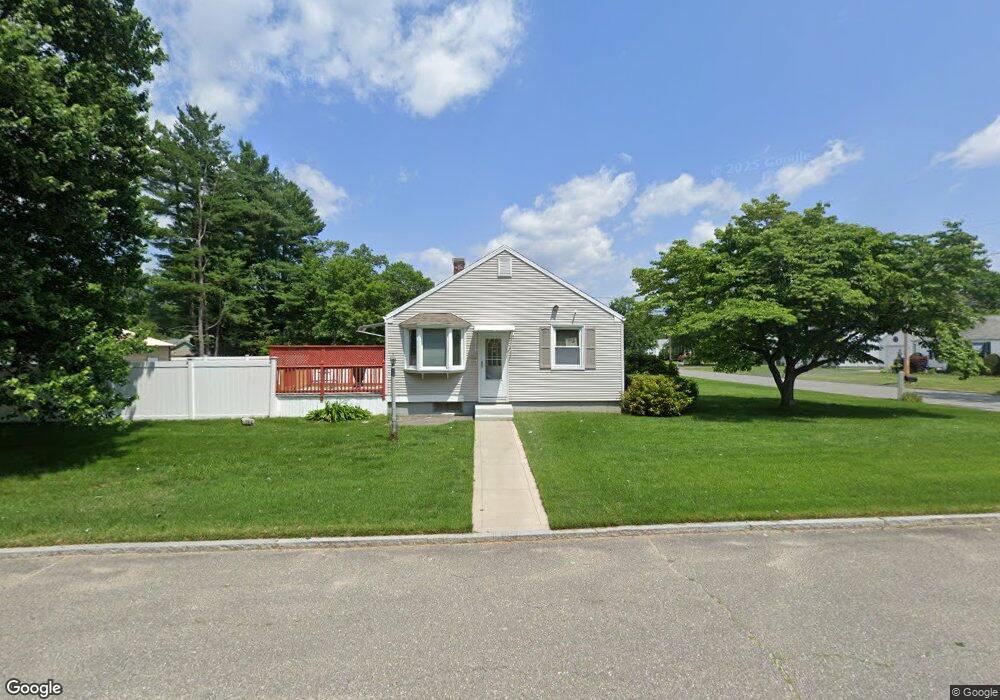
84 Maebeth St Springfield, MA 01119
Sixteen Acres NeighborhoodEstimated Value: $255,000 - $280,000
2
Beds
1
Bath
768
Sq Ft
$350/Sq Ft
Est. Value
About This Home
This home is located at 84 Maebeth St, Springfield, MA 01119 and is currently estimated at $269,160, approximately $350 per square foot. 84 Maebeth St is a home located in Hampden County with nearby schools including Glickman Elementary, John J Duggan Middle, and Springfield High School of Science and Technology.
Ownership History
Date
Name
Owned For
Owner Type
Purchase Details
Closed on
Jan 13, 2003
Sold by
Martinat Annette M and Tapp Diane Edna
Bought by
Martinat Annette M
Current Estimated Value
Home Financials for this Owner
Home Financials are based on the most recent Mortgage that was taken out on this home.
Original Mortgage
$99,655
Outstanding Balance
$43,040
Interest Rate
6.19%
Mortgage Type
Purchase Money Mortgage
Estimated Equity
$226,120
Create a Home Valuation Report for This Property
The Home Valuation Report is an in-depth analysis detailing your home's value as well as a comparison with similar homes in the area
Home Values in the Area
Average Home Value in this Area
Purchase History
| Date | Buyer | Sale Price | Title Company |
|---|---|---|---|
| Martinat Annette M | -- | -- | |
| Major Joseph W | $104,900 | -- |
Source: Public Records
Mortgage History
| Date | Status | Borrower | Loan Amount |
|---|---|---|---|
| Open | Major Joseph W | $99,655 |
Source: Public Records
Tax History
| Year | Tax Paid | Tax Assessment Tax Assessment Total Assessment is a certain percentage of the fair market value that is determined by local assessors to be the total taxable value of land and additions on the property. | Land | Improvement |
|---|---|---|---|---|
| 2025 | $3,340 | $213,000 | $51,800 | $161,200 |
| 2024 | $3,328 | $207,200 | $51,800 | $155,400 |
| 2023 | $3,185 | $186,800 | $49,300 | $137,500 |
| 2022 | $3,235 | $171,900 | $49,300 | $122,600 |
| 2021 | $2,761 | $146,100 | $44,800 | $101,300 |
| 2020 | $2,689 | $137,700 | $44,800 | $92,900 |
| 2019 | $2,493 | $126,700 | $44,800 | $81,900 |
| 2018 | $2,472 | $125,600 | $44,800 | $80,800 |
| 2017 | $2,469 | $125,600 | $44,600 | $81,000 |
| 2016 | $2,477 | $126,000 | $44,600 | $81,400 |
| 2015 | $2,372 | $120,600 | $44,600 | $76,000 |
Source: Public Records
Map
Nearby Homes
Your Personal Tour Guide
Ask me questions while you tour the home.