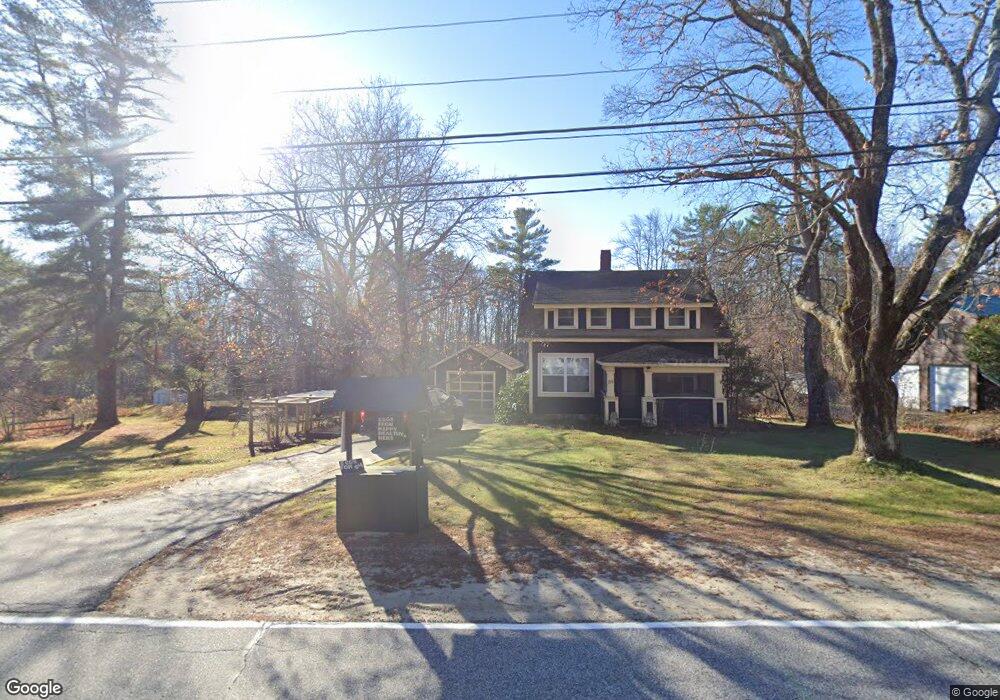
84 Main St Raymond, ME 04071
Estimated Value: $328,095 - $522,000
3
Beds
2
Baths
1,326
Sq Ft
$301/Sq Ft
Est. Value
About This Home
This home is located at 84 Main St, Raymond, ME 04071 and is currently estimated at $399,024, approximately $300 per square foot. 84 Main St is a home located in Cumberland County with nearby schools including Raymond Elementary School, Jordan-Small Middle School, and Windham High School.
Ownership History
Date
Name
Owned For
Owner Type
Purchase Details
Closed on
May 5, 2020
Sold by
Mckillop Amber F
Bought by
Mckillop Amber F and Mckillop Shawn D
Current Estimated Value
Home Financials for this Owner
Home Financials are based on the most recent Mortgage that was taken out on this home.
Original Mortgage
$116,000
Outstanding Balance
$102,513
Interest Rate
3.5%
Mortgage Type
New Conventional
Estimated Equity
$296,511
Create a Home Valuation Report for This Property
The Home Valuation Report is an in-depth analysis detailing your home's value as well as a comparison with similar homes in the area
Home Values in the Area
Average Home Value in this Area
Purchase History
| Date | Buyer | Sale Price | Title Company |
|---|---|---|---|
| Mckillop Amber F | -- | None Available | |
| Mckillop Amber F | -- | None Available | |
| Mckillop Amber F | -- | None Available |
Source: Public Records
Mortgage History
| Date | Status | Borrower | Loan Amount |
|---|---|---|---|
| Open | Mckillop Amber F | $116,000 | |
| Closed | Mckillop Amber F | $116,000 |
Source: Public Records
Tax History
| Year | Tax Paid | Tax Assessment Tax Assessment Total Assessment is a certain percentage of the fair market value that is determined by local assessors to be the total taxable value of land and additions on the property. | Land | Improvement |
|---|---|---|---|---|
| 2024 | $2,313 | $134,500 | $25,400 | $109,100 |
| 2023 | $2,139 | $134,500 | $25,400 | $109,100 |
| 2022 | $2,018 | $134,500 | $25,400 | $109,100 |
| 2021 | $1,896 | $134,500 | $25,400 | $109,100 |
| 2019 | $1,809 | $134,500 | $25,400 | $109,100 |
| 2018 | $2,786 | $134,500 | $25,400 | $109,100 |
| 2017 | $1,654 | $134,500 | $25,400 | $109,100 |
| 2016 | $1,627 | $134,500 | $25,400 | $109,100 |
| 2015 | $1,593 | $133,300 | $25,400 | $107,900 |
| 2014 | $1,573 | $133,300 | $25,400 | $107,900 |
| 2013 | $1,500 | $133,300 | $25,400 | $107,900 |
Source: Public Records
Map
Nearby Homes
- 2 Flynn Rd
- 105 Meadow Rd
- 1525 Roosevelt Trail
- 17 Murray Dr
- 16 Peterson Rd
- 42 Bracken Woods Rd
- 1569 Roosevelt Trail
- 18 Hillside Dr
- 12 Presidential View
- 20 Bittersweet Way
- 0 Heidi Way
- 1112 Roosevelt Trail Unit 8
- 10 Woodland Trail
- Lot 19 Thomas Pond Shore Rd
- 1083 Roosevelt Trail
- 84 Watkins Shores Rd
- 58 Watkins Shores Rd
- 708 Webbs Mills Rd
- 142 Lakewood Rd
- 486 Webbs Mills Rd
Your Personal Tour Guide
Ask me questions while you tour the home.