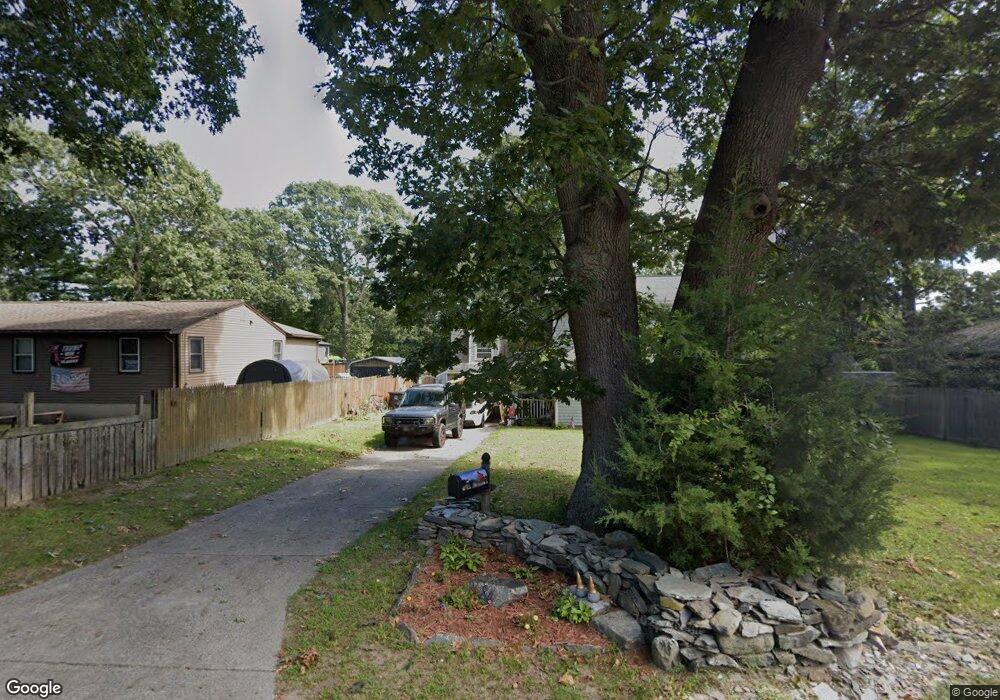
84 Main St Riverside, RI 02915
Riverside NeighborhoodEstimated Value: $445,209 - $491,000
3
Beds
1
Bath
1,746
Sq Ft
$272/Sq Ft
Est. Value
About This Home
This home is located at 84 Main St, Riverside, RI 02915 and is currently estimated at $475,302, approximately $272 per square foot. 84 Main St is a home located in Providence County with nearby schools including East Providence High School, St Mary Academy-Bay View, and St Luke Elementary School.
Ownership History
Date
Name
Owned For
Owner Type
Purchase Details
Closed on
Aug 4, 2011
Sold by
Rhode Island Hsng Mtg & and Rhode Island Hsng
Bought by
Cabral Maria J
Current Estimated Value
Home Financials for this Owner
Home Financials are based on the most recent Mortgage that was taken out on this home.
Original Mortgage
$40,000
Interest Rate
4.58%
Purchase Details
Closed on
May 11, 2011
Sold by
Cabral Maria J
Bought by
Rhode Island Housing A
Create a Home Valuation Report for This Property
The Home Valuation Report is an in-depth analysis detailing your home's value as well as a comparison with similar homes in the area
Home Values in the Area
Average Home Value in this Area
Purchase History
| Date | Buyer | Sale Price | Title Company |
|---|---|---|---|
| Cabral Maria J | -- | -- | |
| Rhode Island Housing A | -- | -- | |
| Cabral Maria J | -- | -- | |
| Rhode Island Housing A | -- | -- |
Source: Public Records
Mortgage History
| Date | Status | Borrower | Loan Amount |
|---|---|---|---|
| Open | Rhode Island Housing A | $70,000 | |
| Closed | Rhode Island Housing A | $40,000 |
Source: Public Records
Tax History
| Year | Tax Paid | Tax Assessment Tax Assessment Total Assessment is a certain percentage of the fair market value that is determined by local assessors to be the total taxable value of land and additions on the property. | Land | Improvement |
|---|---|---|---|---|
| 2025 | $5,367 | $410,600 | $95,300 | $315,300 |
| 2024 | $4,975 | $324,500 | $79,400 | $245,100 |
| 2023 | $4,790 | $324,500 | $79,400 | $245,100 |
| 2022 | $4,759 | $217,700 | $46,900 | $170,800 |
| 2021 | $4,681 | $217,700 | $46,900 | $170,800 |
| 2020 | $4,482 | $217,700 | $46,900 | $170,800 |
| 2019 | $4,358 | $217,700 | $46,900 | $170,800 |
| 2018 | $4,766 | $208,300 | $50,300 | $158,000 |
| 2017 | $4,660 | $208,300 | $50,300 | $158,000 |
| 2016 | $4,637 | $208,300 | $50,300 | $158,000 |
| 2015 | $4,780 | $208,300 | $49,100 | $159,200 |
| 2014 | $4,780 | $208,300 | $49,100 | $159,200 |
Source: Public Records
Map
Nearby Homes
- 72 Stowe Ave
- 14 Winthrop St
- 33 Pine St Unit 35
- 103 Burnside Ave
- 41 White Ave
- 14 Benedict St
- 15 Claire St
- 25 Winslow St
- 10 Booth Ave
- 28 Jefferson Ave
- 129 Shore Rd
- 85 Hilton Ave
- 151 Willett Ave Unit 2
- 0 Carousel Dr
- 15 Plaza Dr
- 43 Bullocks Point Ave Unit 4A
- 916 Bullocks Pt Ave
- 25 Bullocks Point Ave Unit 5C
- 33 Bullocks Point Ave Unit 5C
- 23 Albert Ave
Your Personal Tour Guide
Ask me questions while you tour the home.