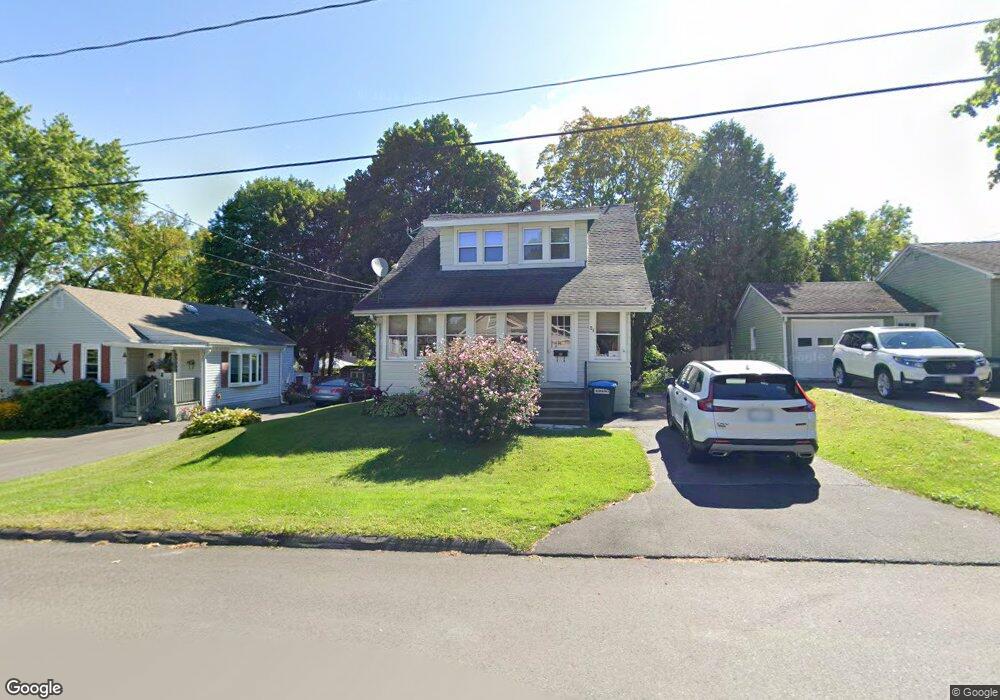
84 Mohegan St Pittsfield, MA 01201
Estimated Value: $230,000 - $266,000
3
Beds
1
Bath
1,148
Sq Ft
$213/Sq Ft
Est. Value
About This Home
This home is located at 84 Mohegan St, Pittsfield, MA 01201 and is currently estimated at $244,697, approximately $213 per square foot. 84 Mohegan St is a home located in Berkshire County with nearby schools including Silvio O. Conte Community School, John T. Reid Middle School, and Taconic High School.
Ownership History
Date
Name
Owned For
Owner Type
Purchase Details
Closed on
Nov 14, 2024
Sold by
Pires Douglas F
Bought by
Dimassimo Melissa and Pires Mitchell
Current Estimated Value
Purchase Details
Closed on
Oct 20, 2015
Sold by
Pires Sharron J and Yon Terrance A
Bought by
Pires Douglas F and Pires Sharron J
Home Financials for this Owner
Home Financials are based on the most recent Mortgage that was taken out on this home.
Original Mortgage
$75,000
Interest Rate
3.88%
Mortgage Type
New Conventional
Create a Home Valuation Report for This Property
The Home Valuation Report is an in-depth analysis detailing your home's value as well as a comparison with similar homes in the area
Home Values in the Area
Average Home Value in this Area
Purchase History
| Date | Buyer | Sale Price | Title Company |
|---|---|---|---|
| Dimassimo Melissa | -- | None Available | |
| Dimassimo Melissa | -- | None Available | |
| Dimassimo Melissa | -- | None Available | |
| Pires Douglas F | $54,000 | -- | |
| Pires Douglas F | $54,000 | -- | |
| Pires Douglas F | $54,000 | -- |
Source: Public Records
Mortgage History
| Date | Status | Borrower | Loan Amount |
|---|---|---|---|
| Previous Owner | Pires Douglas F | $75,000 |
Source: Public Records
Tax History Compared to Growth
Tax History
| Year | Tax Paid | Tax Assessment Tax Assessment Total Assessment is a certain percentage of the fair market value that is determined by local assessors to be the total taxable value of land and additions on the property. | Land | Improvement |
|---|---|---|---|---|
| 2025 | $3,349 | $186,700 | $55,900 | $130,800 |
| 2024 | $3,314 | $179,600 | $55,900 | $123,700 |
| 2023 | $3,089 | $168,600 | $55,900 | $112,700 |
| 2022 | $2,812 | $151,500 | $53,600 | $97,900 |
| 2021 | $2,449 | $127,200 | $53,600 | $73,600 |
| 2020 | $2,282 | $115,800 | $44,700 | $71,100 |
| 2019 | $2,200 | $113,300 | $44,700 | $68,600 |
| 2018 | $2,219 | $110,900 | $44,700 | $66,200 |
| 2017 | $2,073 | $105,600 | $41,900 | $63,700 |
| 2016 | $1,989 | $106,000 | $41,900 | $64,100 |
| 2015 | $1,914 | $106,000 | $41,900 | $64,100 |
Source: Public Records
Map
Nearby Homes