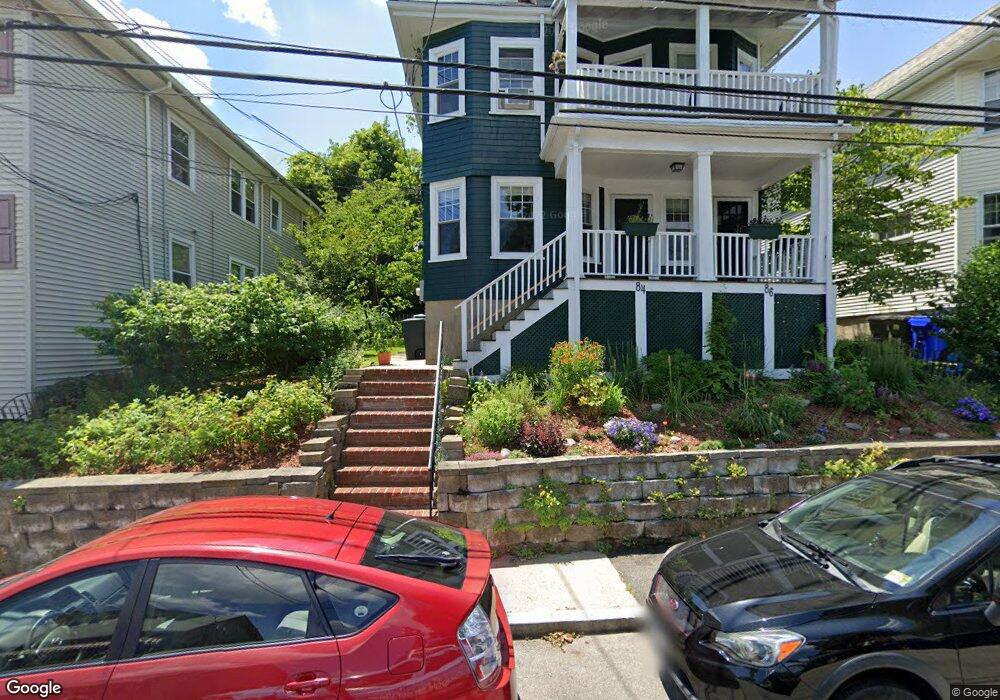
84 Nonantum St Unit 86 Brighton, MA 02135
Brighton NeighborhoodEstimated Value: $940,000 - $1,119,000
4
Beds
2
Baths
2,326
Sq Ft
$446/Sq Ft
Est. Value
About This Home
This home is located at 84 Nonantum St Unit 86, Brighton, MA 02135 and is currently estimated at $1,038,349, approximately $446 per square foot. 84 Nonantum St Unit 86 is a home located in Suffolk County with nearby schools including St Columbkille Partnership School and Shaloh House Jewish Day School.
Ownership History
Date
Name
Owned For
Owner Type
Purchase Details
Closed on
Dec 22, 2014
Sold by
Baker Michael J
Bought by
Baker Deborah B
Current Estimated Value
Purchase Details
Closed on
Sep 25, 1989
Sold by
Flanagan John B
Bought by
Baker Michael J
Create a Home Valuation Report for This Property
The Home Valuation Report is an in-depth analysis detailing your home's value as well as a comparison with similar homes in the area
Home Values in the Area
Average Home Value in this Area
Purchase History
| Date | Buyer | Sale Price | Title Company |
|---|---|---|---|
| Baker Deborah B | -- | -- | |
| Baker Michael J | $210,000 | -- |
Source: Public Records
Mortgage History
| Date | Status | Borrower | Loan Amount |
|---|---|---|---|
| Previous Owner | Baker Michael J | $356,000 | |
| Previous Owner | Baker Michael J | $356,000 | |
| Previous Owner | Baker Michael J | $7,300 |
Source: Public Records
Tax History Compared to Growth
Tax History
| Year | Tax Paid | Tax Assessment Tax Assessment Total Assessment is a certain percentage of the fair market value that is determined by local assessors to be the total taxable value of land and additions on the property. | Land | Improvement |
|---|---|---|---|---|
| 2025 | $9,878 | $853,000 | $267,700 | $585,300 |
| 2024 | $9,018 | $827,300 | $264,200 | $563,100 |
| 2023 | $8,228 | $766,100 | $244,700 | $521,400 |
| 2022 | $7,937 | $729,500 | $233,000 | $496,500 |
| 2021 | $7,784 | $729,500 | $233,000 | $496,500 |
| 2020 | $7,462 | $706,600 | $199,300 | $507,300 |
| 2019 | $7,231 | $686,100 | $161,100 | $525,000 |
| 2018 | $6,717 | $640,900 | $161,100 | $479,800 |
| 2017 | $6,655 | $628,400 | $161,100 | $467,300 |
| 2016 | $6,283 | $571,200 | $161,100 | $410,100 |
| 2015 | $5,942 | $490,700 | $164,700 | $326,000 |
| 2014 | $5,448 | $433,100 | $164,700 | $268,400 |
Source: Public Records
Map
Nearby Homes
- 8 Tremont Place
- 21 Glenley Terrace
- 99 Tremont St Unit 105
- 99 Tremont St Unit 413
- 427-435 Faneuil St Unit R4
- 18 Breck Ave Unit 18
- 121 Tremont St Unit B1
- 14 Atkins St
- 39 Champney St
- 22 Bigelow St
- 34 Larch St Unit 34
- 32-34 Larch St
- 32 Larch St Unit 34
- 365 Faneuil St Unit 2
- 142 Kenrick St Unit 36
- 106 Farlow Rd
- 69 Presentation Rd
- 21 Upcrest Rd
- 116 Lake Shore Rd Unit 4
- 70 Washington St Unit 70
- 80 Nonantum St
- 80 Nonantum St Unit 527
- 80 Nonantum St Unit 526
- 80 Nonantum St Unit 525
- 80 Nonantum St Unit 520
- 80 Nonantum St Unit 514
- 80 Nonantum St Unit 512
- 80 Nonantum St Unit 511
- 80 Nonantum St Unit 2
- 80 Nonantum St Unit 507
- 80 Nonantum Street (Bi)
- 88 Nonantum St Unit 90
- 101 Brayton Rd Unit 103
- 101-103 Brayton Rd
- 105 Brayton Rd
- 76 Nonantum St
- 92 Nonantum St
- 97 Brayton Rd
- 81 Nonantum St Unit 81A
- 81 Nonantum St Unit 2