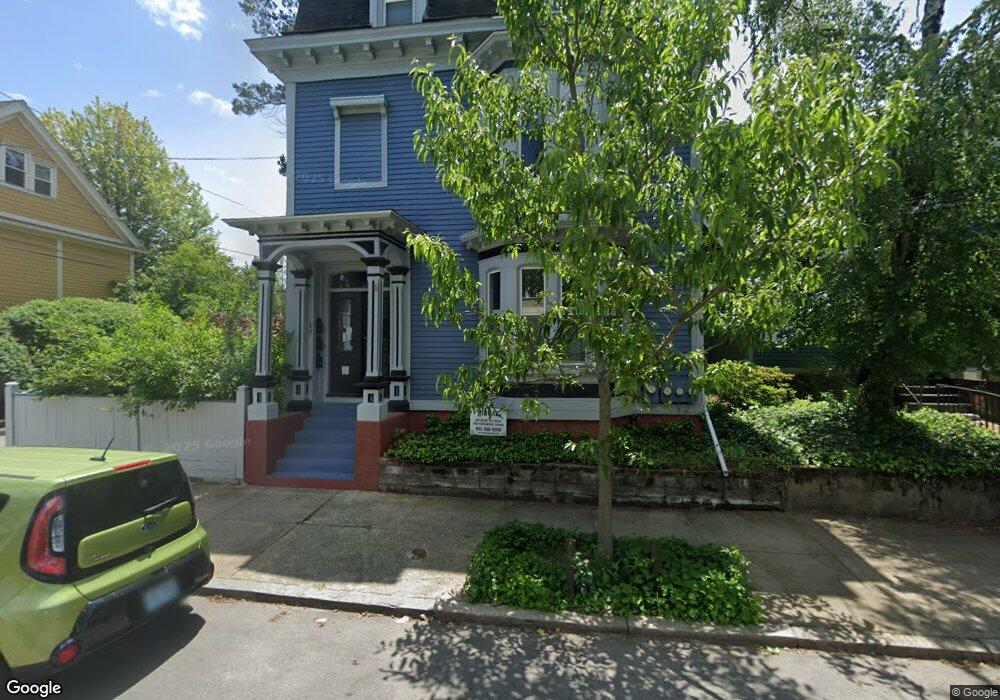
84 Oak St Unit 1 Providence, RI 02909
West End NeighborhoodEstimated Value: $391,000 - $454,000
2
Beds
1
Bath
1,326
Sq Ft
$312/Sq Ft
Est. Value
About This Home
This home is located at 84 Oak St Unit 1, Providence, RI 02909 and is currently estimated at $413,918, approximately $312 per square foot. 84 Oak St Unit 1 is a home located in Providence County with nearby schools including Asa Messer Elementary School, Charles N. Fortes Elementary School, and Alfred Lima Sr. Elementary School.
Ownership History
Date
Name
Owned For
Owner Type
Purchase Details
Closed on
Jun 15, 2010
Sold by
Underwood Matthew and Underwood Andrea
Bought by
Lowney Patrick E
Current Estimated Value
Home Financials for this Owner
Home Financials are based on the most recent Mortgage that was taken out on this home.
Original Mortgage
$112,000
Outstanding Balance
$75,289
Interest Rate
5.11%
Mortgage Type
Purchase Money Mortgage
Estimated Equity
$338,629
Create a Home Valuation Report for This Property
The Home Valuation Report is an in-depth analysis detailing your home's value as well as a comparison with similar homes in the area
Home Values in the Area
Average Home Value in this Area
Purchase History
| Date | Buyer | Sale Price | Title Company |
|---|---|---|---|
| Lowney Patrick E | $140,000 | -- |
Source: Public Records
Mortgage History
| Date | Status | Borrower | Loan Amount |
|---|---|---|---|
| Open | Lowney Patrick E | $112,000 | |
| Closed | Lowney Patrick E | $14,000 |
Source: Public Records
Tax History Compared to Growth
Tax History
| Year | Tax Paid | Tax Assessment Tax Assessment Total Assessment is a certain percentage of the fair market value that is determined by local assessors to be the total taxable value of land and additions on the property. | Land | Improvement |
|---|---|---|---|---|
| 2025 | $4,787 | $327,900 | $0 | $327,900 |
| 2024 | $4,624 | $252,000 | $0 | $252,000 |
| 2023 | $4,624 | $252,000 | $0 | $252,000 |
| 2022 | $2,231 | $252,000 | $0 | $252,000 |
| 2021 | $2,231 | $151,400 | $0 | $151,400 |
| 2020 | $2,231 | $151,400 | $0 | $151,400 |
| 2019 | $3,718 | $151,400 | $0 | $151,400 |
| 2018 | $3,890 | $121,700 | $0 | $121,700 |
| 2017 | $3,890 | $121,700 | $0 | $121,700 |
| 2016 | $3,890 | $121,700 | $0 | $121,700 |
| 2015 | $3,813 | $115,200 | $0 | $115,200 |
| 2014 | $3,888 | $115,200 | $0 | $115,200 |
| 2013 | $3,888 | $115,200 | $0 | $115,200 |
Source: Public Records
Map
Nearby Homes