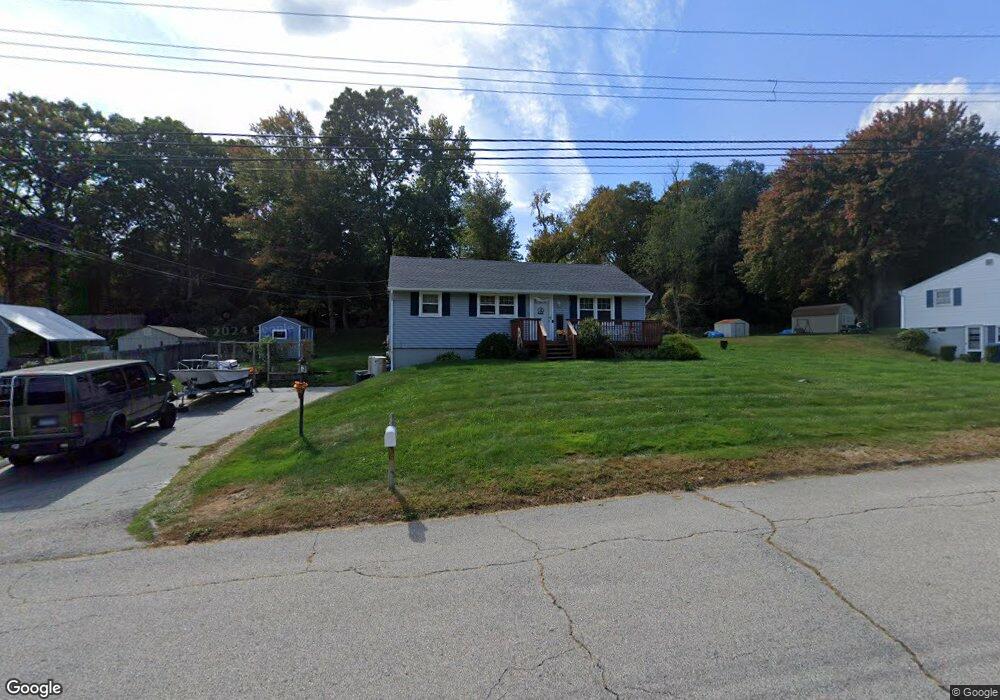
84 Occum Ln Uncasville, CT 06382
Estimated Value: $320,000 - $346,283
3
Beds
2
Baths
1,272
Sq Ft
$264/Sq Ft
Est. Value
About This Home
This home is located at 84 Occum Ln, Uncasville, CT 06382 and is currently estimated at $335,321, approximately $263 per square foot. 84 Occum Ln is a home located in New London County with nearby schools including Leonard J. Tyl Middle School, Montville High School, and Mayflower Montessori School.
Ownership History
Date
Name
Owned For
Owner Type
Purchase Details
Closed on
Aug 5, 2011
Sold by
Vanculin Ryan J
Bought by
Batte Jacquelyn C
Current Estimated Value
Home Financials for this Owner
Home Financials are based on the most recent Mortgage that was taken out on this home.
Original Mortgage
$146,321
Outstanding Balance
$100,665
Interest Rate
4.51%
Mortgage Type
Purchase Money Mortgage
Estimated Equity
$234,657
Purchase Details
Closed on
Aug 28, 2007
Sold by
Citigroup Mtg Loan T
Bought by
Vanculin Ryan J
Purchase Details
Closed on
Sep 20, 2000
Sold by
Department Of Housing & Urban Dev
Bought by
Bellefleur Sharon
Purchase Details
Closed on
Oct 18, 1996
Sold by
Coughlin Raymond W
Bought by
Beetham Shelia M and Beetham Hazel M
Purchase Details
Closed on
Sep 27, 1989
Sold by
Potvin Roger
Bought by
Coughlin Raymond
Create a Home Valuation Report for This Property
The Home Valuation Report is an in-depth analysis detailing your home's value as well as a comparison with similar homes in the area
Home Values in the Area
Average Home Value in this Area
Purchase History
| Date | Buyer | Sale Price | Title Company |
|---|---|---|---|
| Batte Jacquelyn C | -- | -- | |
| Batte Jacquelyn C | -- | -- | |
| Vanculin Ryan J | $190,000 | -- | |
| Vanculin Ryan J | $190,000 | -- | |
| Bellefleur Sharon | $122,000 | -- | |
| Bellefleur Sharon | $122,000 | -- | |
| Beetham Shelia M | $105,000 | -- | |
| Beetham Shelia M | $105,000 | -- | |
| Coughlin Raymond | $138,000 | -- |
Source: Public Records
Mortgage History
| Date | Status | Borrower | Loan Amount |
|---|---|---|---|
| Open | Coughlin Raymond | $146,321 | |
| Closed | Coughlin Raymond | $146,321 |
Source: Public Records
Tax History Compared to Growth
Tax History
| Year | Tax Paid | Tax Assessment Tax Assessment Total Assessment is a certain percentage of the fair market value that is determined by local assessors to be the total taxable value of land and additions on the property. | Land | Improvement |
|---|---|---|---|---|
| 2025 | $4,078 | $141,260 | $31,220 | $110,040 |
| 2024 | $3,923 | $141,260 | $31,220 | $110,040 |
| 2023 | $3,923 | $141,260 | $31,220 | $110,040 |
| 2022 | $3,773 | $141,260 | $31,220 | $110,040 |
| 2021 | $3,359 | $105,810 | $31,040 | $74,770 |
| 2020 | $3,426 | $105,810 | $31,040 | $74,770 |
| 2019 | $3,440 | $105,810 | $31,040 | $74,770 |
| 2018 | $3,357 | $105,810 | $31,040 | $74,770 |
| 2017 | $3,354 | $105,810 | $31,040 | $74,770 |
| 2016 | $3,325 | $108,620 | $38,770 | $69,850 |
| 2015 | $3,325 | $108,620 | $38,770 | $69,850 |
| 2014 | $3,190 | $108,620 | $38,770 | $69,850 |
Source: Public Records
Map
Nearby Homes
- 87 Fort Shantok Rd
- 114 Park Ave
- 2057 Norwich New London Turnpike
- 61 Fort Shantok Rd
- 60 Fort Shantok Rd
- 26 Dydo Dr
- 150 Park Avenue Extension
- 32 Cedar Ln
- 124 Holly Hill Dr
- 9 Morgan St
- 104 Woodland Dr Unit A
- 10 Riched Ln
- 19 Desjardins Dr
- 145 Massapeag Side Rd
- 1465 Norwich-New London Turnpike
- 586 W Thames St Unit 610
- 140 Route 12
- 9 Thamesview Rd
- 15 Drawbridge Rd
- 3 Holdsworth Rd