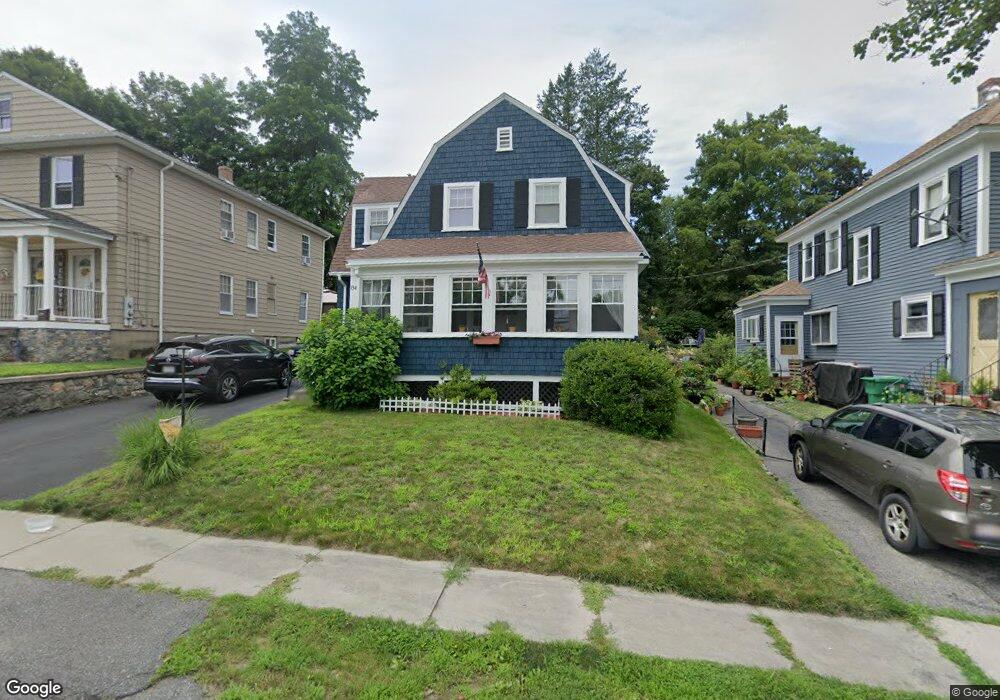
84 Orange St Unit 1 Clinton, MA 01510
Estimated Value: $463,000 - $521,000
4
Beds
2
Baths
2,260
Sq Ft
$224/Sq Ft
Est. Value
About This Home
This home is located at 84 Orange St Unit 1, Clinton, MA 01510 and is currently estimated at $505,771, approximately $223 per square foot. 84 Orange St Unit 1 is a home located in Worcester County with nearby schools including Clinton Elementary School, Clinton Senior High School, and Clinton Middle School.
Ownership History
Date
Name
Owned For
Owner Type
Purchase Details
Closed on
Mar 27, 2025
Sold by
Mclaughlin Mark D and Mclaughlin Mary E
Bought by
Pierre Andrew and Hamidovic Almira
Current Estimated Value
Home Financials for this Owner
Home Financials are based on the most recent Mortgage that was taken out on this home.
Original Mortgage
$518,436
Outstanding Balance
$515,258
Interest Rate
6.75%
Mortgage Type
FHA
Estimated Equity
-$9,487
Purchase Details
Closed on
Jun 11, 2020
Sold by
Ballard Lisa
Bought by
Mclaughlin Mark D and Mclaughlin Mary E
Home Financials for this Owner
Home Financials are based on the most recent Mortgage that was taken out on this home.
Original Mortgage
$283,500
Interest Rate
3.2%
Mortgage Type
New Conventional
Purchase Details
Closed on
May 21, 2019
Sold by
Winn Tracy
Bought by
Fitzsimmons David and Ballard Lisa
Home Financials for this Owner
Home Financials are based on the most recent Mortgage that was taken out on this home.
Original Mortgage
$306,773
Interest Rate
4.62%
Mortgage Type
FHA
Purchase Details
Closed on
Nov 1, 1989
Sold by
Lipka Henry
Bought by
Winn Stephen
Create a Home Valuation Report for This Property
The Home Valuation Report is an in-depth analysis detailing your home's value as well as a comparison with similar homes in the area
Home Values in the Area
Average Home Value in this Area
Purchase History
We collect this data history from publicly available records. To have your information removed, we recommend requesting removal directly through your county’s website.
| Date | Buyer | Sale Price | Title Company |
|---|---|---|---|
| Pierre Andrew | $528,000 | None Available | |
| Pierre Andrew | $528,000 | None Available | |
| Mclaughlin Mark D | $315,000 | None Available | |
| Mclaughlin Mark D | $315,000 | None Available | |
| Fitzsimmons David | $319,900 | -- | |
| Fitzsimmons David | $319,900 | -- | |
| Winn Stephen | $135,000 | -- | |
| Winn Stephen | $135,000 | -- |
Source: Public Records
Mortgage History
We collect this data history from publicly available records. To have your information removed, we recommend requesting removal directly through your county’s website.
| Date | Status | Borrower | Loan Amount |
|---|---|---|---|
| Open | Pierre Andrew | $518,436 | |
| Closed | Pierre Andrew | $518,436 | |
| Previous Owner | Mclaughlin Mark D | $283,500 | |
| Previous Owner | Fitzsimmons David | $306,773 | |
| Previous Owner | Winn Stephen | $128,000 |
Source: Public Records
Tax History
| Year | Tax Paid | Tax Assessment Tax Assessment Total Assessment is a certain percentage of the fair market value that is determined by local assessors to be the total taxable value of land and additions on the property. | Land | Improvement |
|---|---|---|---|---|
| 2025 | $5,570 | $418,800 | $111,100 | $307,700 |
| 2024 | $5,539 | $421,500 | $111,100 | $310,400 |
| 2023 | $5,193 | $388,400 | $101,000 | $287,400 |
| 2022 | $5,168 | $346,600 | $91,800 | $254,800 |
| 2021 | $5,047 | $316,600 | $87,500 | $229,100 |
| 2020 | $4,904 | $316,600 | $87,500 | $229,100 |
| 2019 | $4,610 | $289,400 | $84,900 | $204,500 |
| 2018 | $4,810 | $283,300 | $84,900 | $198,400 |
| 2017 | $4,181 | $236,600 | $84,900 | $151,700 |
| 2016 | $4,261 | $246,700 | $84,900 | $161,800 |
| 2015 | $4,143 | $248,700 | $82,400 | $166,300 |
| 2014 | $4,017 | $248,700 | $82,400 | $166,300 |
Source: Public Records
Map
Nearby Homes
- 388 Water St
- 349 Oak St
- 216 Walnut St
- 129 High St
- 115117 Mechanic St Unit 4
- 115117 Mechanic St
- 115117 Mechanic St Unit 3
- 11 Cromie St
- 212 Chace St
- 112 School St
- 6 Nelson St
- 57 Clark St
- 40 Nashua St Unit 3
- 508 High St
- 719 Main St
- 55 Sterling St Unit 306
- 55 Sterling St Unit 314
- 55 Sterling St Unit 208
- 55 Sterling St Unit 305
- 11 Lindbergh Street Rear
- 82 Haskell Ave
- 90 Haskell Ave
- 74 Haskell Ave
- 79 Orange St
- 73 Haskell Ave
- 73 Haskell Ave Unit 2
- 83 Orange St
- 96 Haskell Ave Unit 1
- 98 Haskell Ave Unit 1
- 80 Beech St
- 87 Haskell Ave
- 87 Orange St
- 60 Haskell Ave
- 99 Haskell Ave Unit 3
- 99 Haskell Ave
- 99 Haskell Ave Unit 1
- 99 Haskell Ave Unit 2
- 76 Orange St
- 89 Orange St
- 56 Beech St
Your Personal Tour Guide
Ask me questions while you tour the home.