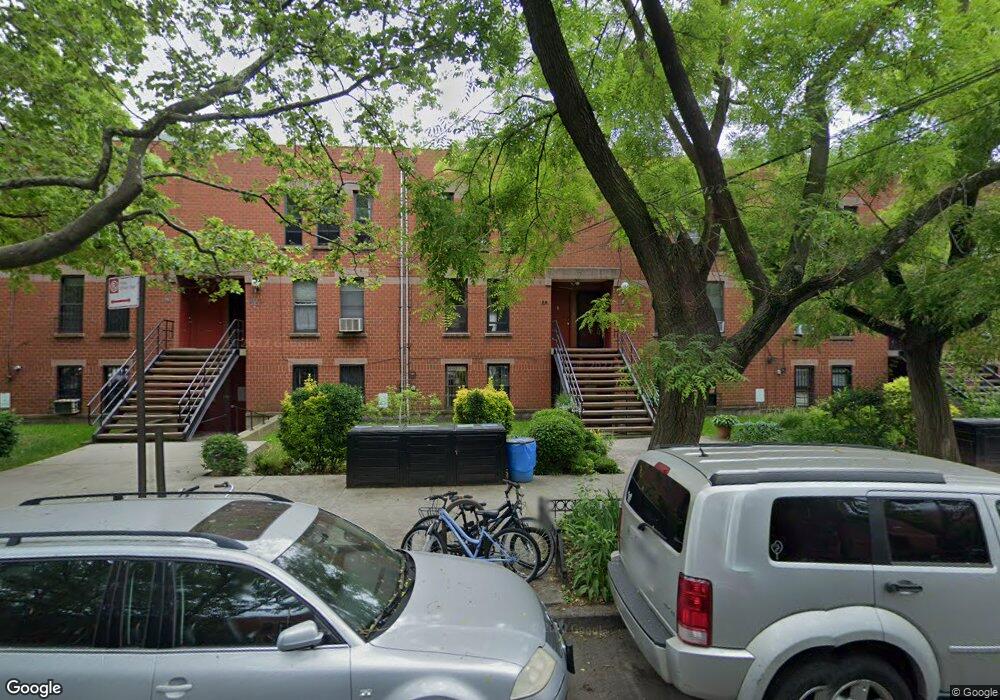
84 President St Unit 12AG Brooklyn, NY 11231
Carroll Gardens NeighborhoodEstimated Value: $942,725 - $1,754,000
--
Bed
--
Bath
754
Sq Ft
$1,617/Sq Ft
Est. Value
About This Home
This home is located at 84 President St Unit 12AG, Brooklyn, NY 11231 and is currently estimated at $1,219,181, approximately $1,616 per square foot. 84 President St Unit 12AG is a home located in Kings County with nearby schools including P.S. 29 John M. Harrigan, International School of Brooklyn, and Hannah Senesh Community Day School.
Ownership History
Date
Name
Owned For
Owner Type
Purchase Details
Closed on
Apr 2, 2015
Sold by
Doliner Roy
Bought by
Champness Jessica
Current Estimated Value
Home Financials for this Owner
Home Financials are based on the most recent Mortgage that was taken out on this home.
Original Mortgage
$500,000
Outstanding Balance
$386,581
Interest Rate
3.86%
Mortgage Type
New Conventional
Estimated Equity
$832,600
Purchase Details
Closed on
Nov 19, 2012
Sold by
Cap Pawel
Bought by
Dettler Oliver and Lerner Ellen
Home Financials for this Owner
Home Financials are based on the most recent Mortgage that was taken out on this home.
Original Mortgage
$363,000
Interest Rate
3.4%
Mortgage Type
New Conventional
Purchase Details
Closed on
Jul 27, 2000
Sold by
Martucci Beau
Bought by
Doliner Roy
Home Financials for this Owner
Home Financials are based on the most recent Mortgage that was taken out on this home.
Original Mortgage
$135,000
Interest Rate
8.16%
Create a Home Valuation Report for This Property
The Home Valuation Report is an in-depth analysis detailing your home's value as well as a comparison with similar homes in the area
Home Values in the Area
Average Home Value in this Area
Purchase History
| Date | Buyer | Sale Price | Title Company |
|---|---|---|---|
| Champness Jessica | $625,000 | -- | |
| Dettler Oliver | $523,000 | -- | |
| Doliner Roy | $150,000 | -- |
Source: Public Records
Mortgage History
| Date | Status | Borrower | Loan Amount |
|---|---|---|---|
| Open | Champness Jessica | $500,000 | |
| Previous Owner | Dettler Oliver | $363,000 | |
| Previous Owner | Doliner Roy | $135,000 |
Source: Public Records
Tax History Compared to Growth
Tax History
| Year | Tax Paid | Tax Assessment Tax Assessment Total Assessment is a certain percentage of the fair market value that is determined by local assessors to be the total taxable value of land and additions on the property. | Land | Improvement |
|---|---|---|---|---|
| 2025 | $3,218 | $54,618 | $1,790 | $52,828 |
| 2024 | $3,218 | $58,003 | $1,790 | $56,213 |
| 2023 | $3,229 | $61,492 | $1,790 | $59,702 |
| 2022 | $2,995 | $56,689 | $1,790 | $54,899 |
| 2021 | $2,979 | $52,084 | $1,790 | $50,294 |
| 2020 | $1,397 | $41,817 | $1,790 | $40,027 |
| 2019 | $2,793 | $36,356 | $1,790 | $34,566 |
| 2018 | $2,701 | $13,251 | $583 | $12,668 |
| 2017 | $2,548 | $12,502 | $594 | $11,908 |
| 2016 | $2,358 | $11,795 | $646 | $11,149 |
| 2015 | $1,203 | $11,128 | $799 | $10,329 |
| 2014 | $1,203 | $11,128 | $797 | $10,331 |
Source: Public Records
Map
Nearby Homes
- 81 President St Unit 51-A
- 113 Union St Unit 3A
- 118 Union St Unit 9A
- 255 Columbia St Unit S-4
- 124 President St
- 115 Van Brunt St
- 57 Summit St
- 139 Sackett St Unit 2
- 10 Carroll St
- 130 Degraw St
- 589 Hicks St Unit 1
- 145 President St Unit 6-C
- 145 President St Unit 3-B
- 181 Columbia St
- 178 Sackett St
- 113 Carroll St Unit 4
- 177 Union St Unit 2
- 37 Woodhull St
- 60 Tiffany Place Unit 2G
- 39 Woodhull St
- 76 President St
- 76 President St Unit 15A2
- 76 President St Unit 15A1
- 76 President St Unit 15AG
- 78 President St Unit 14A2
- 78 President St Unit 14A1
- 78 President St Unit 14AG
- 82 President St Unit 13A2
- 82 President St Unit 13A1
- 82 President St Unit 13AG
- 84 President St Unit 12A2
- 84 President St Unit 12A1
- 88 President St Unit 11A2
- 88 President St Unit 11A1
- 88 President St Unit 11AG
- 90 President St Unit 10A2
- 90 President St Unit 10A1
- 90 President St Unit 10AG
- 90 President St Unit 10 A
- 82 President St Unit 3-R