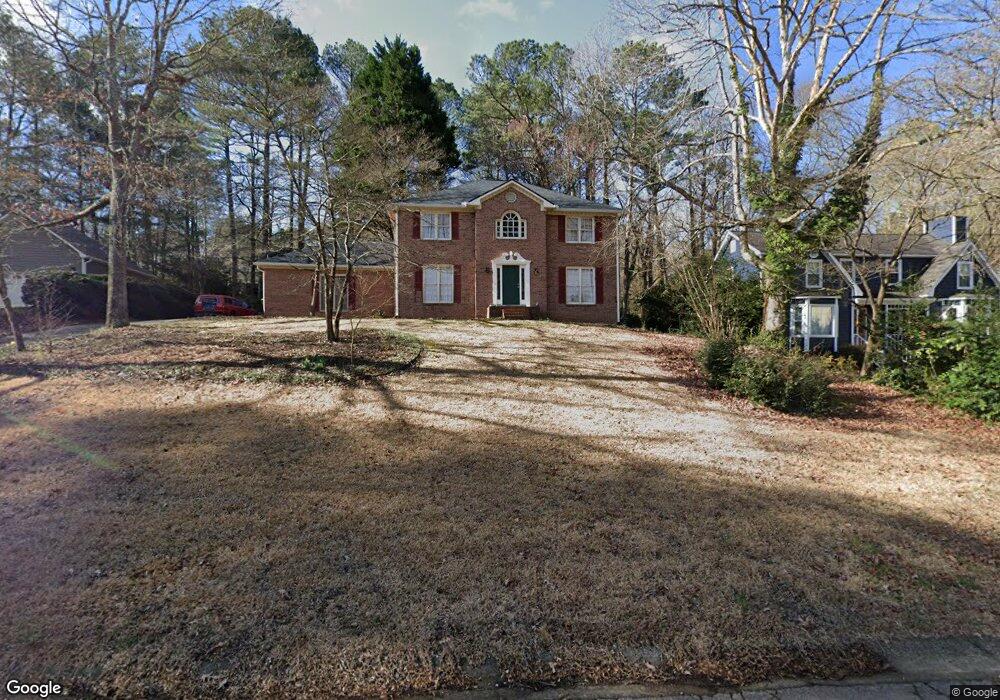
84 Queen Anne Dr SE Mableton, GA 30126
Estimated Value: $443,081 - $564,000
4
Beds
4
Baths
2,608
Sq Ft
$187/Sq Ft
Est. Value
About This Home
This home is located at 84 Queen Anne Dr SE, Mableton, GA 30126 and is currently estimated at $487,520, approximately $186 per square foot. 84 Queen Anne Dr SE is a home located in Cobb County with nearby schools including Mableton Elementary School, Floyd Middle School, and Covered Bridge Academy.
Ownership History
Date
Name
Owned For
Owner Type
Purchase Details
Closed on
Dec 9, 2011
Sold by
Thurmond Ralph N
Bought by
Thurmond Stuart M and Thurmond Susan Y
Current Estimated Value
Purchase Details
Closed on
Nov 23, 2009
Sold by
Us Bk National Assn
Bought by
Thurmond Ralph N and Thurmond Stuart M
Purchase Details
Closed on
Sep 1, 2009
Sold by
Farnum Courtennay J
Bought by
Us Bk National Assn
Purchase Details
Closed on
Feb 1, 1999
Sold by
Federal National Mortgage Association
Bought by
Farnum David E and Farnum Courtenay
Home Financials for this Owner
Home Financials are based on the most recent Mortgage that was taken out on this home.
Original Mortgage
$165,713
Interest Rate
6.84%
Mortgage Type
FHA
Purchase Details
Closed on
Mar 31, 1995
Sold by
Mann Thomas G Jayne
Bought by
Johnson Ernest
Create a Home Valuation Report for This Property
The Home Valuation Report is an in-depth analysis detailing your home's value as well as a comparison with similar homes in the area
Home Values in the Area
Average Home Value in this Area
Purchase History
| Date | Buyer | Sale Price | Title Company |
|---|---|---|---|
| Thurmond Stuart M | -- | -- | |
| Thurmond Ralph N | $117,500 | -- | |
| Us Bk National Assn | $146,175 | -- | |
| Farnum David E | -- | -- | |
| Johnson Ernest | $155,000 | -- |
Source: Public Records
Mortgage History
| Date | Status | Borrower | Loan Amount |
|---|---|---|---|
| Previous Owner | Farnum David E | $165,713 | |
| Closed | Johnson Ernest | $0 |
Source: Public Records
Tax History Compared to Growth
Tax History
| Year | Tax Paid | Tax Assessment Tax Assessment Total Assessment is a certain percentage of the fair market value that is determined by local assessors to be the total taxable value of land and additions on the property. | Land | Improvement |
|---|---|---|---|---|
| 2025 | $5,129 | $212,044 | $34,000 | $178,044 |
| 2024 | $5,546 | $231,116 | $30,000 | $201,116 |
| 2023 | $3,330 | $153,972 | $24,000 | $129,972 |
| 2022 | $3,902 | $153,972 | $24,000 | $129,972 |
| 2021 | $3,556 | $138,168 | $22,000 | $116,168 |
| 2020 | $3,371 | $129,732 | $22,000 | $107,732 |
| 2019 | $3,371 | $129,732 | $22,000 | $107,732 |
| 2018 | $3,018 | $113,592 | $18,000 | $95,592 |
| 2017 | $2,885 | $113,592 | $18,000 | $95,592 |
| 2016 | $2,593 | $100,268 | $18,000 | $82,268 |
| 2015 | $2,405 | $90,488 | $18,000 | $72,488 |
| 2014 | $2,088 | $79,116 | $0 | $0 |
Source: Public Records
Map
Nearby Homes
- 51 Queen Anne Dr SE
- 35 Dunaire Ct SW
- 0 Nickajack Rd SE Unit 7594642
- 4724 Warrior Way SE Unit II
- 5020 Hickory Mill Dr SE
- 4094 Norton Place SE
- 4025 Benell Ct SE
- 188 Covered Bridge Trail SW
- 4246 Antler Trail SE
- 4875 Millen Dr SE
- 221 Shady Ln SW
- 4800 Timberland Dr SW
- 0 East-West Connector Unit 11589710
- 4195 Antler Trail SE
- 3910 W Cooper Lake Dr SE
- 26 Flint Ridge Dr SE
- 4135 Fawn Ln SE
- 416 Nickajack Retreat Ln
- 80 Queen Anne Dr SE
- 86 Queen Anne Dr SE
- 88 Queen Anne Dr SE
- 70 Queen Anne Dr SE
- 83 Queen Anne Dr SE
- 18 Anastasia Dr SE
- 87 Queen Anne Dr SE
- 16 Anastasia Dr SE
- 81 Queen Anne Dr SE
- 85 Queen Anne Dr SE
- 20 Anastasia Dr SE
- 71 Queen Anne Dr SE
- 60 Queen Anne Dr SE
- 24 Anastasia Dr SE
- 26 Anastasia Dr SE
- 14 Anastasia Dr SE
- 0 Anastasia Dr SE Unit 7517084
- 0 Anastasia Dr SE Unit 7241071
- 0 Anastasia Dr SE Unit 7124825
- 0 Anastasia Dr SE Unit 7103078