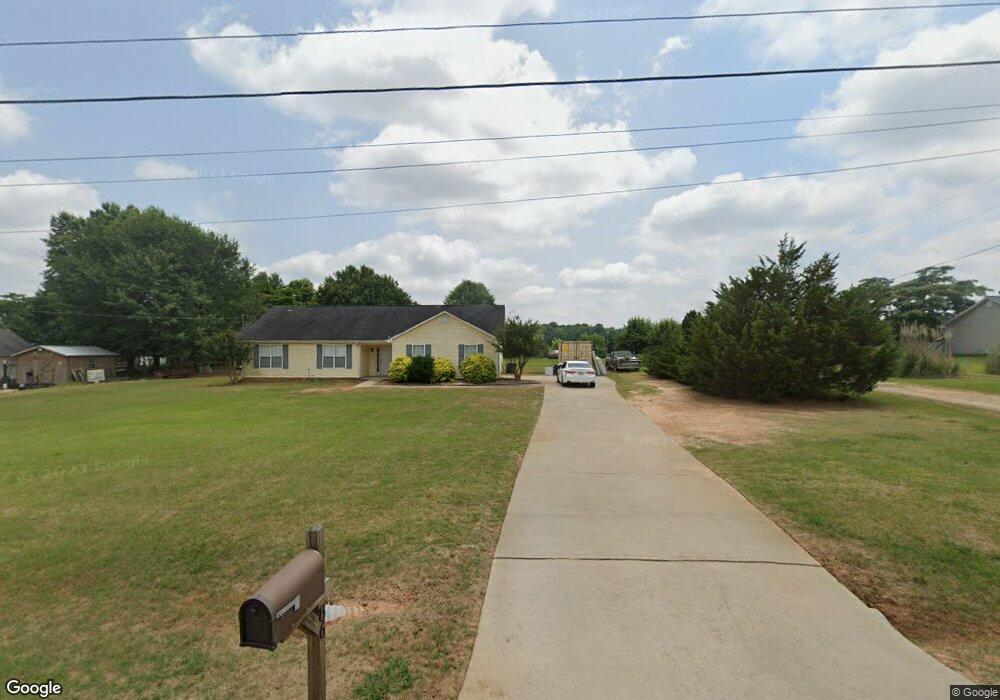
84 Snapping Shoals Rd McDonough, GA 30252
Estimated Value: $243,000 - $319,000
4
Beds
2
Baths
1,472
Sq Ft
$198/Sq Ft
Est. Value
About This Home
This home is located at 84 Snapping Shoals Rd, McDonough, GA 30252 and is currently estimated at $291,765, approximately $198 per square foot. 84 Snapping Shoals Rd is a home located in Henry County with nearby schools including Ola Elementary School, Ola Middle School, and Ola High School.
Ownership History
Date
Name
Owned For
Owner Type
Purchase Details
Closed on
Dec 20, 2019
Sold by
Eckerson Michelle
Bought by
Eckerson James
Current Estimated Value
Purchase Details
Closed on
Feb 12, 2010
Sold by
Hud-Housing Of Urban Dev
Bought by
Eckerson James and Eckerson Lisa
Home Financials for this Owner
Home Financials are based on the most recent Mortgage that was taken out on this home.
Original Mortgage
$82,041
Interest Rate
5.5%
Mortgage Type
FHA
Purchase Details
Closed on
Jul 7, 2009
Sold by
Bac Home Loans Servicing
Bought by
Hud-Housing Of Urban Dev
Purchase Details
Closed on
Aug 28, 2001
Sold by
Emerald Homebuilders Inc
Bought by
Lumpkin Buffy
Home Financials for this Owner
Home Financials are based on the most recent Mortgage that was taken out on this home.
Original Mortgage
$137,712
Interest Rate
6.98%
Mortgage Type
New Conventional
Create a Home Valuation Report for This Property
The Home Valuation Report is an in-depth analysis detailing your home's value as well as a comparison with similar homes in the area
Home Values in the Area
Average Home Value in this Area
Purchase History
| Date | Buyer | Sale Price | Title Company |
|---|---|---|---|
| Eckerson James | -- | -- | |
| Eckerson James | -- | -- | |
| Hud-Housing Of Urban Dev | -- | -- | |
| Bac Home Loans Servicing | $175,915 | -- | |
| Lumpkin Buffy | $138,800 | -- |
Source: Public Records
Mortgage History
| Date | Status | Borrower | Loan Amount |
|---|---|---|---|
| Previous Owner | Eckerson James | $82,041 | |
| Previous Owner | Lumpkin Buffy | $137,712 |
Source: Public Records
Tax History Compared to Growth
Tax History
| Year | Tax Paid | Tax Assessment Tax Assessment Total Assessment is a certain percentage of the fair market value that is determined by local assessors to be the total taxable value of land and additions on the property. | Land | Improvement |
|---|---|---|---|---|
| 2025 | $5,121 | $128,520 | $32,320 | $96,200 |
| 2024 | $5,121 | $121,920 | $29,120 | $92,800 |
| 2023 | $4,622 | $119,440 | $28,040 | $91,400 |
| 2022 | $3,845 | $99,200 | $25,880 | $73,320 |
| 2021 | $3,083 | $79,320 | $22,200 | $57,120 |
| 2020 | $2,763 | $71,000 | $20,920 | $50,080 |
| 2019 | $2,630 | $67,520 | $19,840 | $47,680 |
| 2018 | $2,377 | $60,920 | $18,320 | $42,600 |
| 2016 | $2,061 | $52,680 | $16,160 | $36,520 |
| 2015 | $1,905 | $47,160 | $18,640 | $28,520 |
| 2014 | $1,715 | $41,840 | $18,640 | $23,200 |
Source: Public Records
Map
Nearby Homes
- 323 Snapping Shoals Rd
- 100 Tapestry Dr
- 156 Tapestry Dr
- 504 Liverpool Dr
- 276 Arwen Dr
- 276 Arwen Dr Unit LOT 122
- 272 Arwen Dr Unit LOT 123
- 272 Arwen Dr
- 268 Arwen Dr
- 268 Arwen Dr Unit LOT 124
- 264 Arwen Dr
- 264 Arwen Dr Unit 125
- 252 Arwen Dr
- 300 Arwen Dr Unit LOT 116
- 304 Arwen Dr
- 300 Arwen Dr
- 248 Arwen Dr
- 244 Arwen Dr
- 244 Arwen Dr Unit LOT 132
- 0 Keys Ferry Rd Unit 10362682
- 86 Snapping Shoals Rd
- 88 Snapping Shoals Rd
- 82 Snapping Shoals Rd
- 80 Snapping Shoals Rd
- 90 Snapping Shoals Rd
- 76 Snapping Shoals Rd
- 74 Snapping Shoals Rd
- 64 Snapping Shoals Rd
- 299 Snapping Shoals Rd
- 305 Snapping Shoals Rd
- 309 Snapping Shoals Rd
- 295 Snapping Shoals Rd
- 72 Snapping Shoals Rd
- 52 Snapping Shoals Rd
- 289 Snapping Shoals Rd
- 315 Snapping Shoals Rd
- 44 Snapping Shoals Rd
- 297 Snapping Shoals Rd
- 287 Snapping Shoals Rd
- 32 Snapping Shoals Rd