84 Strada Principale Henderson, NV 89011
Lake Las Vegas NeighborhoodEstimated Value: $448,000 - $819,000
2
Beds
3
Baths
1,860
Sq Ft
$371/Sq Ft
Est. Value
About This Home
This home is located at 84 Strada Principale, Henderson, NV 89011 and is currently estimated at $690,762, approximately $371 per square foot. 84 Strada Principale is a home located in Clark County with nearby schools including Josh Stevens Elementary School, B Mahlon Brown Academy of International Studies, and Basic Academy of International Studies.
Ownership History
Date
Name
Owned For
Owner Type
Purchase Details
Closed on
Aug 1, 2013
Sold by
Demayo James Eugene
Bought by
James Eugene Demayo Irrevocable Trust
Current Estimated Value
Purchase Details
Closed on
Dec 11, 2012
Sold by
Ying Virginia Hui
Bought by
Ying Oscar J and The Viriginia Hui Ying Irrevocable Trust
Purchase Details
Closed on
Nov 25, 2012
Sold by
Ying Virginia Hui
Bought by
Ying Oscar J and Virginia Hui Ying Irrevocable Trust
Purchase Details
Closed on
Nov 24, 2012
Sold by
Ying Virginia Hui
Bought by
Ying Virginia Hui and Virginia Hui Ying Heritage Trust
Purchase Details
Closed on
Dec 29, 2009
Sold by
Ying Virginia Hui
Bought by
Ying Oscar J and Ying Richard J
Purchase Details
Closed on
Oct 26, 2007
Sold by
Ying Virginia Hui
Bought by
Ying Oscar J and Ying Richard J
Purchase Details
Closed on
Sep 20, 2007
Sold by
Prima Condominiums Llc
Bought by
Ying Virginia Hui and Demayo James Eugene
Create a Home Valuation Report for This Property
The Home Valuation Report is an in-depth analysis detailing your home's value as well as a comparison with similar homes in the area
Home Values in the Area
Average Home Value in this Area
Purchase History
| Date | Buyer | Sale Price | Title Company |
|---|---|---|---|
| James Eugene Demayo Irrevocable Trust | -- | None Available | |
| Ying Oscar J | -- | None Available | |
| Ying Oscar J | -- | None Available | |
| Ying Virginia Hui | -- | None Available | |
| Ying Oscar J | -- | None Available | |
| Ying Oscar J | -- | None Available | |
| Ying Virginia Hui | $853,274 | Nevada Title Company |
Source: Public Records
Tax History
| Year | Tax Paid | Tax Assessment Tax Assessment Total Assessment is a certain percentage of the fair market value that is determined by local assessors to be the total taxable value of land and additions on the property. | Land | Improvement |
|---|---|---|---|---|
| 2026 | $3,628 | $227,912 | $77,700 | $150,212 |
| 2024 | $3,421 | $228,493 | $76,440 | $152,053 |
| 2023 | $3,421 | $204,594 | $61,425 | $143,169 |
| 2022 | $3,321 | $178,469 | $47,320 | $131,149 |
| 2021 | $3,225 | $171,795 | $47,320 | $124,475 |
| 2020 | $3,129 | $160,067 | $45,500 | $114,567 |
| 2019 | $3,038 | $153,762 | $38,675 | $115,087 |
| 2018 | $2,949 | $135,846 | $31,850 | $103,996 |
| 2017 | $3,824 | $131,926 | $25,725 | $106,201 |
| 2016 | $2,791 | $131,869 | $23,520 | $108,349 |
| 2015 | $2,785 | $102,064 | $23,520 | $78,544 |
| 2014 | $2,704 | $90,636 | $12,863 | $77,773 |
Source: Public Records
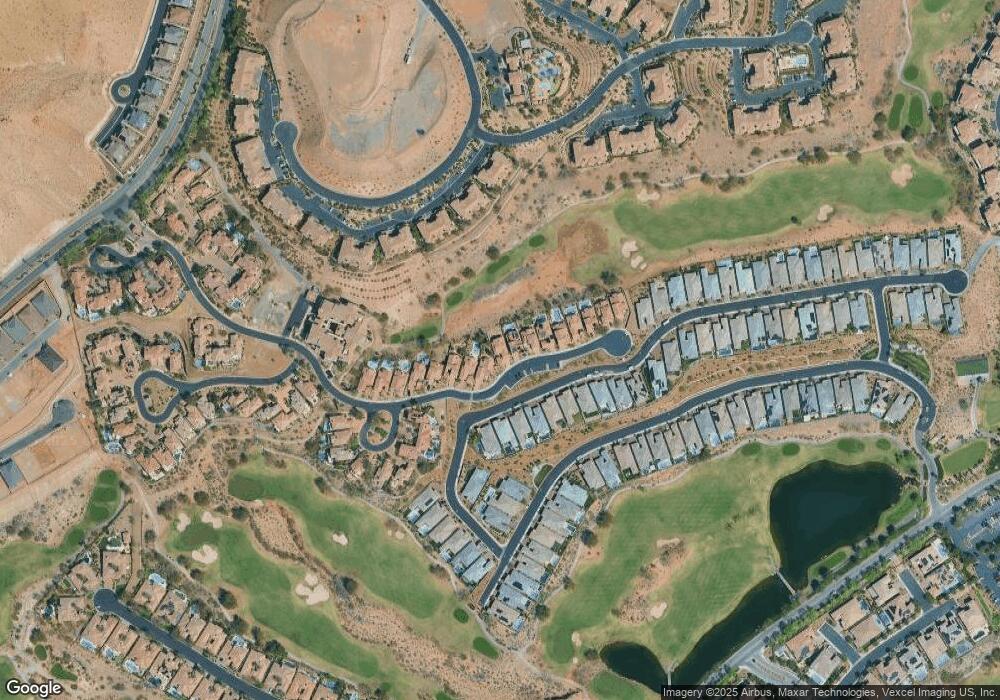
Map
Nearby Homes
- 72 Strada Principale
- 24 Via Vasari Unit 204
- 87 Reflection Bay Dr
- 118 Reflection Cove Dr
- 64 Strada Principale Unit 104
- 71 Reflection Bay Dr
- 64 Reflection Cove Dr
- 32 Cerchio Basso
- 30 Via Vasari Unit 102
- 30 Via Vasari Unit 104
- 30 Via Vasari Unit 103
- 30 Strada Principale
- 32 Via Vasari Unit 103
- 10 Strada Principale
- 18 Cerchio Alto
- 1605 Amalfi Arches Place
- 1441 Bianca Falls Dr
- 19 Via Visione Unit 201
- 10 Via Visione Unit 204
- 24 Kimberlite Dr
- 86 Strada Principale
- 82 Strada Principale
- 88 Strada Principale
- 80 Strada Principale
- 90 Strada Principale
- 78 Strada Principale
- 76 Strada Principale
- 94 Strada Principale
- 103 Reflection Cove Dr
- 107 Reflection Cove Dr
- 74 Strada Principale
- 99 Reflection Cove Dr
- 111 Reflection Cove Dr
- 96 Strada Principale
- 24 Cerchio Centrale
- 22 Cerchio Centrale Unit None
- 22 Cerchio Centrale
- 98 Strada Principale
- 87 Reflection Cove Dr
Your Personal Tour Guide
Ask me questions while you tour the home.