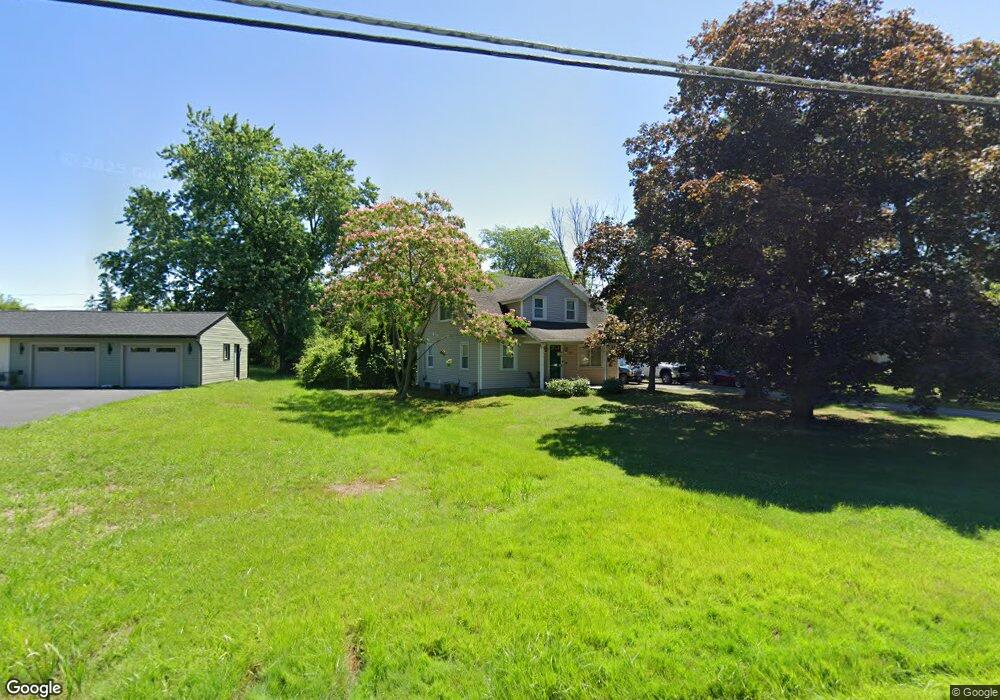
84 Summer Sky Dr Rochester, NY 14623
Estimated Value: $258,000 - $292,000
3
Beds
2
Baths
1,422
Sq Ft
$196/Sq Ft
Est. Value
About This Home
This home is located at 84 Summer Sky Dr, Rochester, NY 14623 and is currently estimated at $279,232, approximately $196 per square foot. 84 Summer Sky Dr is a home located in Monroe County with nearby schools including David B. Crane Elementary School, Charles H. Roth Junior High School, and Rush-Henrietta Senior High School.
Ownership History
Date
Name
Owned For
Owner Type
Purchase Details
Closed on
Jul 15, 2010
Sold by
Gress Dustin
Bought by
Terry Ii Richard A and Torres Yanira
Current Estimated Value
Home Financials for this Owner
Home Financials are based on the most recent Mortgage that was taken out on this home.
Original Mortgage
$131,725
Outstanding Balance
$88,187
Interest Rate
4.87%
Mortgage Type
FHA
Estimated Equity
$191,045
Purchase Details
Closed on
Jul 19, 2005
Sold by
Barker Michael
Bought by
Gress Dustin
Home Financials for this Owner
Home Financials are based on the most recent Mortgage that was taken out on this home.
Original Mortgage
$129,681
Interest Rate
5.54%
Mortgage Type
New Conventional
Purchase Details
Closed on
Jun 17, 2002
Sold by
Reed Robert R
Bought by
Barker Michael J
Purchase Details
Closed on
Jun 6, 1994
Sold by
Cherubin Jean and Cherubin Deborah
Bought by
Sibley Mortgage Corp
Create a Home Valuation Report for This Property
The Home Valuation Report is an in-depth analysis detailing your home's value as well as a comparison with similar homes in the area
Home Values in the Area
Average Home Value in this Area
Purchase History
| Date | Buyer | Sale Price | Title Company |
|---|---|---|---|
| Terry Ii Richard A | $133,500 | None Available | |
| Gress Dustin | $129,681 | -- | |
| Barker Michael J | $101,300 | William Macdonald | |
| Sibley Mortgage Corp | $86,020 | -- |
Source: Public Records
Mortgage History
| Date | Status | Borrower | Loan Amount |
|---|---|---|---|
| Open | Terry Ii Richard A | $131,725 | |
| Previous Owner | Gress Dustin | $129,681 |
Source: Public Records
Tax History Compared to Growth
Tax History
| Year | Tax Paid | Tax Assessment Tax Assessment Total Assessment is a certain percentage of the fair market value that is determined by local assessors to be the total taxable value of land and additions on the property. | Land | Improvement |
|---|---|---|---|---|
| 2024 | $5,173 | $207,000 | $40,000 | $167,000 |
| 2023 | $5,042 | $207,000 | $40,000 | $167,000 |
| 2022 | $5,073 | $164,400 | $20,900 | $143,500 |
| 2021 | $5,096 | $155,100 | $20,900 | $134,200 |
| 2020 | $4,414 | $155,100 | $20,900 | $134,200 |
| 2019 | $3,931 | $141,000 | $20,900 | $120,100 |
| 2018 | $4,284 | $141,000 | $20,900 | $120,100 |
| 2017 | $2,074 | $133,500 | $20,100 | $113,400 |
| 2016 | $3,931 | $133,500 | $20,100 | $113,400 |
| 2015 | -- | $133,500 | $20,100 | $113,400 |
| 2014 | -- | $133,500 | $20,100 | $113,400 |
Source: Public Records
Map
Nearby Homes
- 517 Wildbriar Rd
- 44 Chiltern Rd
- 39 Castle Rd
- 85 Lalanne Rd
- 93 Lalanne Rd
- 36 Hartwood Dr
- 64 Hartwood Dr
- 16 Burt Dr
- 16 Hayden St
- 160 Finucane Rd
- 83 Greenbrier Ln
- 173 Hollybrook Rd
- 78 Golden Rod Ln
- 55 Agar Ave
- 1108 Farnsworth Rd S
- 87 Colony Ln
- 16 Down St
- 65 Masthead Way
- 1168 Calkins Rd
- 4495 W Henrietta Rd
- 92 Summer Sky Dr
- 448 Wildbriar Rd
- 68 Summer Sky Dr
- 440 Wildbriar Rd
- 100 Summer Sky Dr
- 456 Wildbriar Rd
- 432 Wildbriar Rd
- 464 Wildbriar Rd
- 60 Summer Sky Dr
- 108 Summer Sky Dr
- 424 Wildbriar Rd
- 472 Wildbriar Rd
- 52 Summer Sky Dr
- 416 Wildbriar Rd
- 116 Summer Sky Dr
- 449 Wildbriar Rd
- 49 Summer Sky Dr
- 441 Wildbriar Rd
- 457 Wildbriar Rd
- 480 Wildbriar Rd