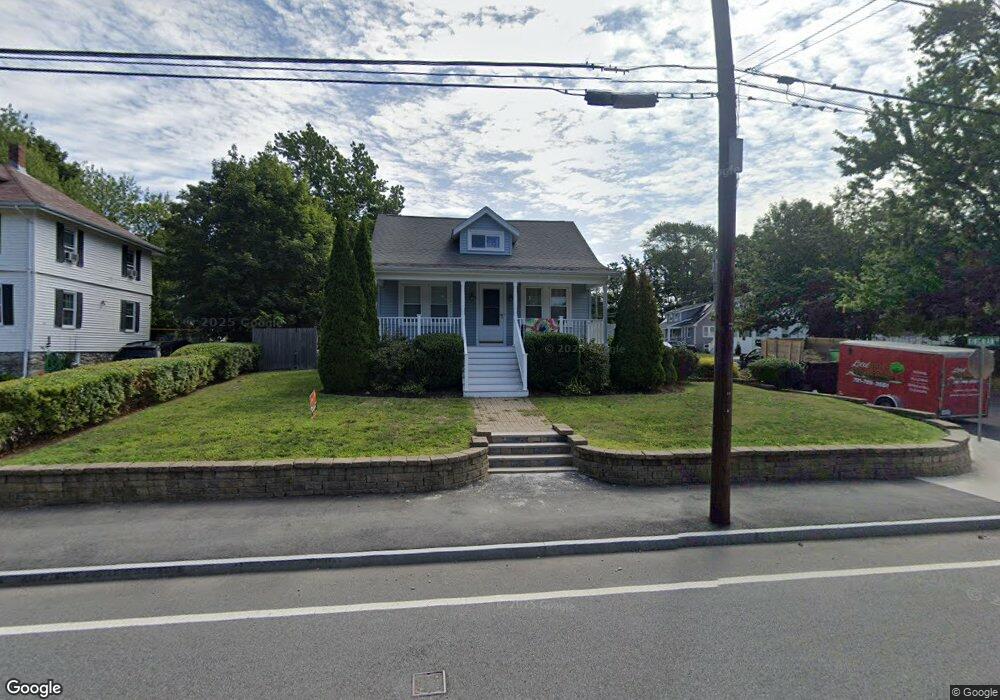
84 Summer St Weymouth, MA 02188
Weymouth Landing NeighborhoodEstimated Value: $610,989 - $714,000
4
Beds
3
Baths
1,476
Sq Ft
$442/Sq Ft
Est. Value
About This Home
This home is located at 84 Summer St, Weymouth, MA 02188 and is currently estimated at $652,247, approximately $441 per square foot. 84 Summer St is a home located in Norfolk County with nearby schools including Frederick C Murphy, Abigail Adams Middle School, and Weymouth Middle School Chapman.
Ownership History
Date
Name
Owned For
Owner Type
Purchase Details
Closed on
Jul 13, 2006
Sold by
Cordani Karen M and Cordani William R
Bought by
Karen Mcordani T
Current Estimated Value
Purchase Details
Closed on
Sep 18, 1990
Sold by
Ellis Charles W
Bought by
Cordani William R
Home Financials for this Owner
Home Financials are based on the most recent Mortgage that was taken out on this home.
Original Mortgage
$108,000
Interest Rate
9.76%
Mortgage Type
Purchase Money Mortgage
Create a Home Valuation Report for This Property
The Home Valuation Report is an in-depth analysis detailing your home's value as well as a comparison with similar homes in the area
Home Values in the Area
Average Home Value in this Area
Purchase History
| Date | Buyer | Sale Price | Title Company |
|---|---|---|---|
| Karen Mcordani T | -- | -- | |
| Cordani William R | $120,000 | -- |
Source: Public Records
Mortgage History
| Date | Status | Borrower | Loan Amount |
|---|---|---|---|
| Open | Cordani William R | $130,000 | |
| Previous Owner | Cordani William R | $106,000 | |
| Previous Owner | Cordani William R | $108,000 |
Source: Public Records
Tax History Compared to Growth
Tax History
| Year | Tax Paid | Tax Assessment Tax Assessment Total Assessment is a certain percentage of the fair market value that is determined by local assessors to be the total taxable value of land and additions on the property. | Land | Improvement |
|---|---|---|---|---|
| 2025 | $4,883 | $483,500 | $201,900 | $281,600 |
| 2024 | $4,731 | $460,700 | $192,300 | $268,400 |
| 2023 | $4,564 | $436,700 | $178,000 | $258,700 |
| 2022 | $4,451 | $388,400 | $164,900 | $223,500 |
| 2021 | $4,098 | $349,100 | $164,900 | $184,200 |
| 2020 | $3,905 | $327,600 | $164,900 | $162,700 |
| 2019 | $3,809 | $314,300 | $158,500 | $155,800 |
| 2018 | $3,694 | $295,500 | $150,900 | $144,600 |
| 2017 | $3,537 | $276,100 | $143,800 | $132,300 |
| 2016 | $3,401 | $265,700 | $138,300 | $127,400 |
| 2015 | $3,282 | $254,400 | $138,300 | $116,100 |
| 2014 | $3,145 | $236,500 | $128,700 | $107,800 |
Source: Public Records
Map
Nearby Homes
- 76 Kingman St
- 15 Summer St
- 33 Congress St
- 24 Blake Rd
- 16 Lindbergh Ave
- 23-25 Lindbergh Ave
- 114 Broad St Unit D
- 114 Broad St Unit C
- 11 Richmond St
- 19 Vine St Unit 3
- 19 Vine St Unit 1
- 122 Washington St Unit 22
- 36 Brookside Rd
- 37 Lantern Ln
- 51 Faxon St
- 97 Liberty St
- 230 Lisle St
- 141 Commercial St Unit 9
- 286 Broad St
- 12 Klasson Ln