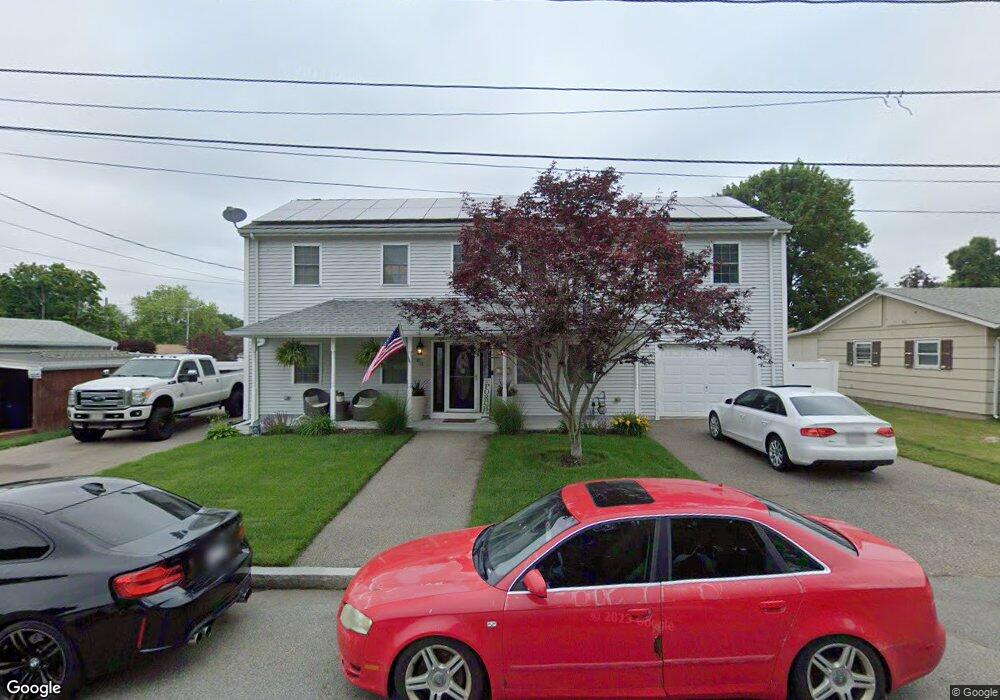
84 Windsor St Fall River, MA 02723
Bank Street NeighborhoodEstimated Value: $442,000 - $535,000
4
Beds
2
Baths
2,200
Sq Ft
$224/Sq Ft
Est. Value
About This Home
This home is located at 84 Windsor St, Fall River, MA 02723 and is currently estimated at $492,409, approximately $223 per square foot. 84 Windsor St is a home located in Bristol County with nearby schools including Mary Fonseca Elementary School, Talbot Innovation School, and B M C Durfee High School.
Ownership History
Date
Name
Owned For
Owner Type
Purchase Details
Closed on
Apr 9, 2013
Sold by
Stanley Frank M and Stanley Kelly
Bought by
Stanley Kelly
Current Estimated Value
Home Financials for this Owner
Home Financials are based on the most recent Mortgage that was taken out on this home.
Original Mortgage
$223,190
Outstanding Balance
$158,324
Interest Rate
3.58%
Mortgage Type
New Conventional
Estimated Equity
$334,085
Purchase Details
Closed on
Mar 15, 2011
Sold by
Cabral Walter R and Cabral Ana P
Bought by
Stanley Frank M and Stanley Kelly
Home Financials for this Owner
Home Financials are based on the most recent Mortgage that was taken out on this home.
Original Mortgage
$224,071
Interest Rate
4.83%
Mortgage Type
Purchase Money Mortgage
Purchase Details
Closed on
Jan 23, 2003
Sold by
Flavin John M
Bought by
Cabral Walter R and Cabral Ana P
Create a Home Valuation Report for This Property
The Home Valuation Report is an in-depth analysis detailing your home's value as well as a comparison with similar homes in the area
Home Values in the Area
Average Home Value in this Area
Purchase History
| Date | Buyer | Sale Price | Title Company |
|---|---|---|---|
| Stanley Kelly | -- | -- | |
| Stanley Frank M | $229,900 | -- | |
| Cabral Walter R | $145,000 | -- |
Source: Public Records
Mortgage History
| Date | Status | Borrower | Loan Amount |
|---|---|---|---|
| Open | Cabral Walter R | $223,190 | |
| Previous Owner | Cabral Walter R | $224,071 | |
| Previous Owner | Cabral Walter R | $50,000 |
Source: Public Records
Tax History Compared to Growth
Tax History
| Year | Tax Paid | Tax Assessment Tax Assessment Total Assessment is a certain percentage of the fair market value that is determined by local assessors to be the total taxable value of land and additions on the property. | Land | Improvement |
|---|---|---|---|---|
| 2025 | $3,973 | $347,000 | $135,700 | $211,300 |
| 2024 | $3,748 | $326,200 | $130,500 | $195,700 |
| 2023 | $3,774 | $307,600 | $117,100 | $190,500 |
| 2022 | $3,262 | $258,500 | $108,400 | $150,100 |
| 2021 | $3,361 | $243,000 | $102,400 | $140,600 |
| 2020 | $3,646 | $252,300 | $98,600 | $153,700 |
| 2019 | $3,584 | $245,800 | $98,600 | $147,200 |
| 2018 | $3,481 | $238,100 | $98,600 | $139,500 |
| 2017 | $3,301 | $235,800 | $98,600 | $137,200 |
| 2016 | $3,109 | $228,100 | $98,600 | $129,500 |
| 2015 | $2,944 | $225,100 | $92,200 | $132,900 |
| 2014 | $2,832 | $225,100 | $92,200 | $132,900 |
Source: Public Records
Map
Nearby Homes
- 168 Windsor St
- 302 Oak Grove Ave
- 243 Oak Grove Ave
- 225 Rich St
- 309 Doherty St
- 344 Beattie St Unit 5
- 1073 New Boston Rd
- 70 Chesworth St
- 1243 New Boston Rd
- 36 Fordney St
- 14 Downing St
- 65 Beattie St
- 23 Lexington St
- 580 County St
- 108 Garden St
- 217 Plain St
- 218 Plain St
- 992 Pine St
- 32 Quequechan St
- 33 Plain St
- 98 Windsor St
- 461 N Eastern Ave
- 81 Dunbar St
- 489 N Eastern Ave
- 97 Dunbar St
- 110 Windsor St
- 77 Windsor St
- 101 Windsor St
- 111 Dunbar St
- 431 N Eastern Ave
- 119 Windsor St
- 128 Windsor St
- 125 Dunbar St
- 76 Austin St
- 517 N Eastern Ave
- 127 Windsor St
- 96 Dunbar St
- 100 Austin St
- 468 N Eastern Ave
- 480 N Eastern Ave