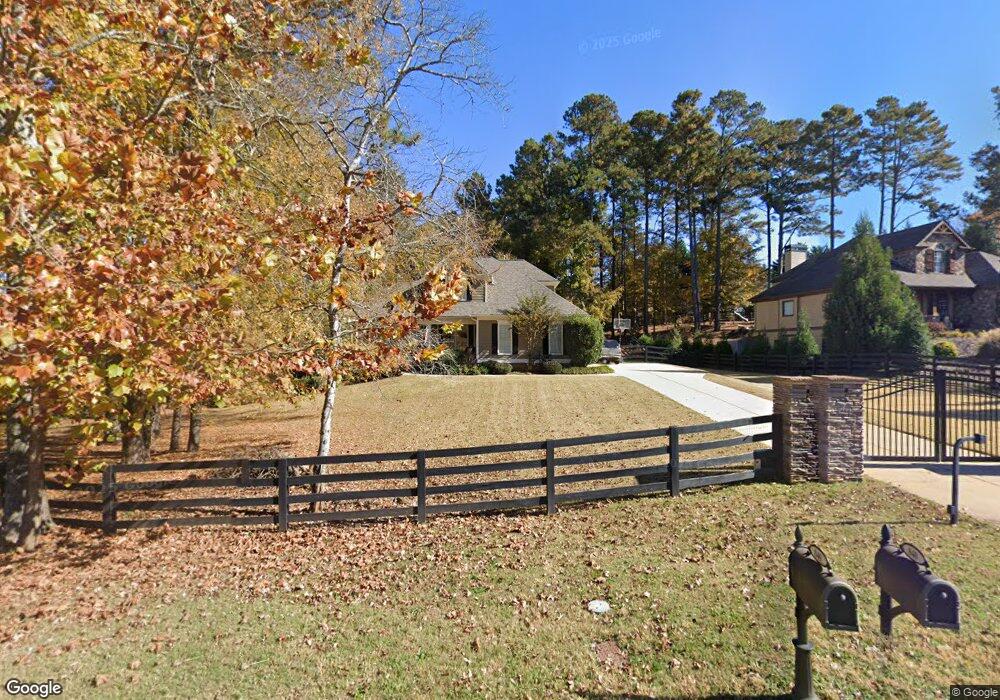
840 Acworth Due West Rd NW Kennesaw, GA 30152
West Cobb NeighborhoodEstimated Value: $455,351 - $640,000
4
Beds
3
Baths
2,230
Sq Ft
$234/Sq Ft
Est. Value
About This Home
This home is located at 840 Acworth Due West Rd NW, Kennesaw, GA 30152 and is currently estimated at $520,838, approximately $233 per square foot. 840 Acworth Due West Rd NW is a home located in Cobb County with nearby schools including Due West Elementary School, Mcclure Middle School, and Harrison High School.
Ownership History
Date
Name
Owned For
Owner Type
Purchase Details
Closed on
Dec 14, 2016
Sold by
Reece Amy E
Bought by
Pawlowski Amy and Pawlowski Doug
Current Estimated Value
Purchase Details
Closed on
Dec 12, 2008
Sold by
Penington Carl E
Bought by
Reece Amy E
Home Financials for this Owner
Home Financials are based on the most recent Mortgage that was taken out on this home.
Original Mortgage
$167,785
Interest Rate
6.1%
Mortgage Type
FHA
Purchase Details
Closed on
Aug 29, 2005
Sold by
Fairways Properties
Bought by
Pennington Carl E
Home Financials for this Owner
Home Financials are based on the most recent Mortgage that was taken out on this home.
Original Mortgage
$250,000
Interest Rate
8.38%
Mortgage Type
New Conventional
Create a Home Valuation Report for This Property
The Home Valuation Report is an in-depth analysis detailing your home's value as well as a comparison with similar homes in the area
Home Values in the Area
Average Home Value in this Area
Purchase History
| Date | Buyer | Sale Price | Title Company |
|---|---|---|---|
| Pawlowski Amy | -- | -- | |
| Reece Amy E | $170,000 | -- | |
| Pennington Carl E | $250,000 | -- |
Source: Public Records
Mortgage History
| Date | Status | Borrower | Loan Amount |
|---|---|---|---|
| Previous Owner | Reece Amy E | $167,785 | |
| Previous Owner | Pennington Carl E | $250,000 |
Source: Public Records
Tax History Compared to Growth
Tax History
| Year | Tax Paid | Tax Assessment Tax Assessment Total Assessment is a certain percentage of the fair market value that is determined by local assessors to be the total taxable value of land and additions on the property. | Land | Improvement |
|---|---|---|---|---|
| 2025 | $4,354 | $166,776 | $50,264 | $116,512 |
| 2024 | $4,357 | $166,776 | $50,264 | $116,512 |
| 2023 | $3,616 | $157,608 | $44,464 | $113,144 |
| 2022 | $3,816 | $140,620 | $32,864 | $107,756 |
| 2021 | $3,269 | $116,728 | $23,972 | $92,756 |
| 2020 | $3,246 | $115,956 | $23,200 | $92,756 |
| 2019 | $3,246 | $115,956 | $23,200 | $92,756 |
| 2018 | $2,542 | $92,776 | $23,200 | $69,576 |
| 2017 | $2,300 | $88,908 | $19,332 | $69,576 |
| 2016 | $2,301 | $88,908 | $19,332 | $69,576 |
| 2015 | $2,250 | $85,196 | $19,332 | $65,864 |
| 2014 | $2,269 | $85,196 | $0 | $0 |
Source: Public Records
Map
Nearby Homes
- 4155 Burnt Hickory Rd NW
- 975 W Mill Bend NW
- 0 W Pointe Dr NW Unit 7522802
- 0 W Pointe Dr NW Unit 10457092
- 1015 Token Way NW
- 978 W Mill Bend NW
- 1034 W Mill Dr NW Unit 1
- 3816 Whithorn Way
- 701 Elk Cove Ct NW
- 4203 W Mill Trail NW
- 4219 W Mill Trail NW
- 1442 Crestwind Rd NW
- 1395 Crestwind Rd NW
- 4120 Chanticleer Dr NW
- 345 Vineyard Dr NW
- 3873 Paul Samuel Rd NW
- 3910 Lisas Dr NW
- 820 Acworth Due West Rd NW
- 4035 Southdown Ln NW
- 809 Acworth Due West Rd NW
- 4045 Southdown Ln NW
- 0 Abbey Oaks Ln NW Unit 8443224
- 0 Abbey Oaks Ln NW Unit 7639158
- 0 Abbey Oaks Ln NW Unit 8909123
- 0 Abbey Oaks Ln NW
- 3892 Stone Lake Dr NW
- 3892 Stone Lakes Dr NW
- 803 Acworth Due West Rd NW
- 4040 Abbey Oaks Ln NW
- 3890 Stone Lake Dr NW
- 3890 Stone Lakes Dr NW
- 4035 Abbey Oaks Ln NW
- 4025 Southdown Ln NW
- 4035 Abbey Oaks Ln NW
- 0 Southdown Ln Unit 8346174
- 0 Southdown Ln Unit 8228541
- 0 Southdown Ln Unit 8780194