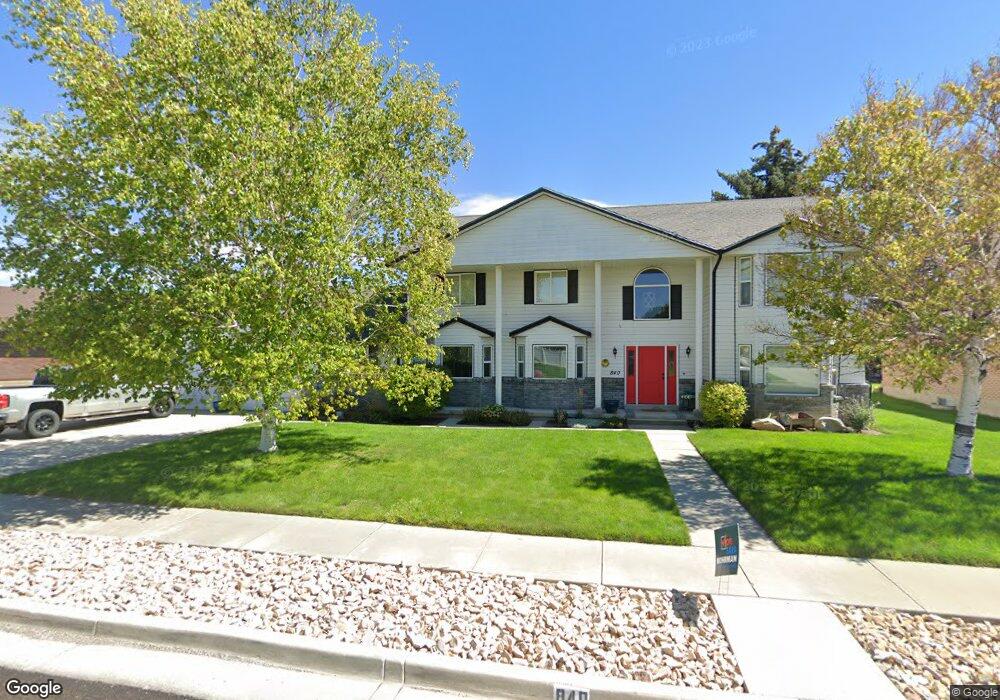
840 N 350 E Tremonton, UT 84337
Estimated Value: $455,609 - $493,000
Studio
--
Bath
2,910
Sq Ft
$165/Sq Ft
Est. Value
About This Home
This home is located at 840 N 350 E, Tremonton, UT 84337 and is currently estimated at $481,152, approximately $165 per square foot. 840 N 350 E is a home located in Box Elder County with nearby schools including North Park School, Bear River Middle School, and Alice C. Harris Intermediate School.
Ownership History
Date
Name
Owned For
Owner Type
Purchase Details
Closed on
Apr 18, 2019
Sold by
Miller Todd J and Miller Kayla C
Bought by
Rawlinson Cody and Rawlinson Jordan
Current Estimated Value
Home Financials for this Owner
Home Financials are based on the most recent Mortgage that was taken out on this home.
Original Mortgage
$193,200
Outstanding Balance
$170,199
Interest Rate
4.4%
Mortgage Type
New Conventional
Estimated Equity
$310,953
Purchase Details
Closed on
Feb 7, 2013
Sold by
Potter Brent M and Potter Katherine M
Bought by
Potter Brent M and The Brent M Potter Family Revocable Trus
Purchase Details
Closed on
May 6, 2005
Sold by
Rose Aluminum Inc
Bought by
Potter Timothy M and Potter Kelly
Home Financials for this Owner
Home Financials are based on the most recent Mortgage that was taken out on this home.
Original Mortgage
$158,273
Interest Rate
6.02%
Mortgage Type
Unknown
Create a Home Valuation Report for This Property
The Home Valuation Report is an in-depth analysis detailing your home's value as well as a comparison with similar homes in the area
Home Values in the Area
Average Home Value in this Area
Purchase History
| Date | Buyer | Sale Price | Title Company |
|---|---|---|---|
| Rawlinson Cody | -- | American Secure Ttl Tremonto | |
| Potter Brent M | -- | Accommodation | |
| Potter Timothy M | -- | None Available |
Source: Public Records
Mortgage History
| Date | Status | Borrower | Loan Amount |
|---|---|---|---|
| Open | Rawlinson Cody | $193,200 | |
| Previous Owner | Potter Timothy M | $158,273 |
Source: Public Records
Tax History
| Year | Tax Paid | Tax Assessment Tax Assessment Total Assessment is a certain percentage of the fair market value that is determined by local assessors to be the total taxable value of land and additions on the property. | Land | Improvement |
|---|---|---|---|---|
| 2025 | $2,968 | $461,871 | $150,000 | $311,871 |
| 2024 | $2,691 | $465,912 | $150,000 | $315,912 |
| 2023 | $2,896 | $492,278 | $155,000 | $337,278 |
| 2022 | $2,266 | $399,488 | $45,000 | $354,488 |
| 2021 | $2,192 | $290,176 | $45,000 | $245,176 |
| 2020 | $1,884 | $290,176 | $45,000 | $245,176 |
| 2019 | $1,754 | $144,084 | $24,750 | $119,334 |
| 2018 | $1,524 | $114,320 | $24,008 | $90,312 |
| 2017 | $1,574 | $207,853 | $24,008 | $164,203 |
| 2016 | $1,551 | $110,019 | $24,008 | $86,011 |
| 2015 | $1,418 | $102,200 | $24,008 | $78,192 |
| 2014 | $1,418 | $98,476 | $24,008 | $74,468 |
| 2013 | -- | $98,476 | $24,008 | $74,468 |
Source: Public Records
Map
Nearby Homes
Your Personal Tour Guide
Ask me questions while you tour the home.