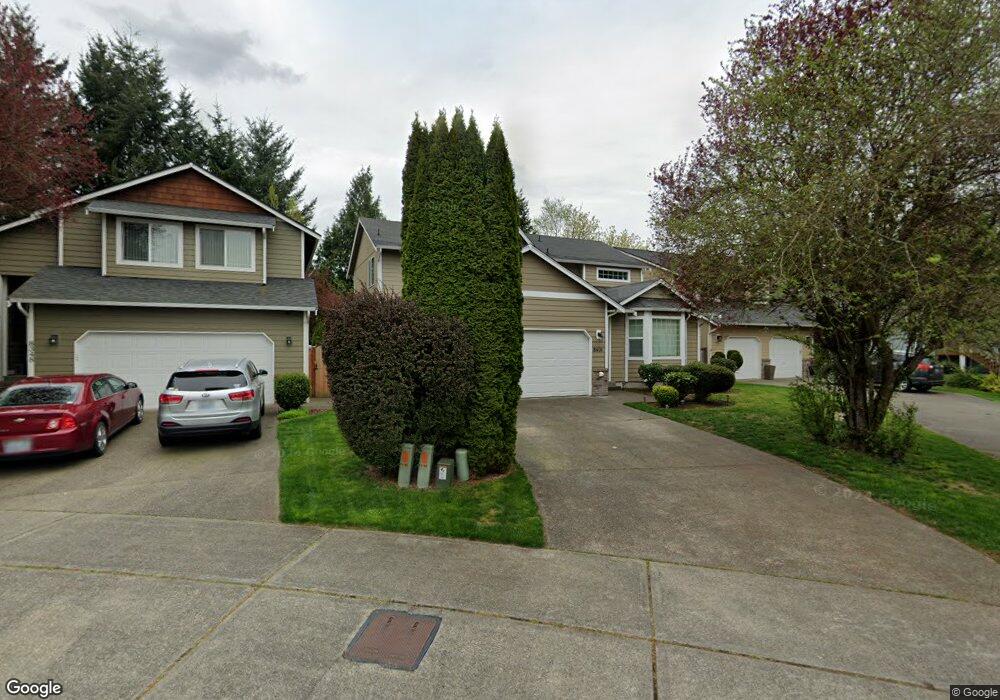
8400 49th Loop SE Olympia, WA 98513
The Lakes NeighborhoodEstimated Value: $478,000 - $544,000
4
Beds
3
Baths
1,973
Sq Ft
$256/Sq Ft
Est. Value
About This Home
This home is located at 8400 49th Loop SE, Olympia, WA 98513 and is currently estimated at $505,827, approximately $256 per square foot. 8400 49th Loop SE is a home located in Thurston County with nearby schools including Woodland Elementary School, Komachin Middle School, and Timberline High School.
Ownership History
Date
Name
Owned For
Owner Type
Purchase Details
Closed on
Feb 14, 2018
Sold by
Eastside Funding Llc
Bought by
Boyal Charanjit
Current Estimated Value
Purchase Details
Closed on
Feb 9, 2018
Sold by
North Cascasde Trustee Services Inc
Bought by
Charanjit Boyal And Eastside Funding Llc
Purchase Details
Closed on
Feb 2, 2018
Sold by
Eastside Funding Llc
Bought by
Boyal Charanjit
Purchase Details
Closed on
Jan 18, 2005
Sold by
Sound Built Homes Inc
Bought by
Nuyda Leo C and Nuyda Marlyn A
Home Financials for this Owner
Home Financials are based on the most recent Mortgage that was taken out on this home.
Original Mortgage
$183,960
Interest Rate
5.87%
Mortgage Type
Unknown
Purchase Details
Closed on
Jul 29, 2004
Sold by
Mullen Heights Llc
Bought by
Sound Built Homes Inc
Home Financials for this Owner
Home Financials are based on the most recent Mortgage that was taken out on this home.
Original Mortgage
$2,541,600
Interest Rate
6.24%
Mortgage Type
Construction
Create a Home Valuation Report for This Property
The Home Valuation Report is an in-depth analysis detailing your home's value as well as a comparison with similar homes in the area
Home Values in the Area
Average Home Value in this Area
Purchase History
| Date | Buyer | Sale Price | Title Company |
|---|---|---|---|
| Boyal Charanjit | -- | None Listed On Document | |
| National Bank Of Kansas City | -- | None Listed On Document | |
| Charanjit Boyal And Eastside Funding Llc | -- | None Available | |
| Boyal Charanjit | -- | None Available | |
| Nuyda Leo C | $229,950 | Stewart Title Of Wester | |
| Sound Built Homes Inc | $690,000 | First American Title |
Source: Public Records
Mortgage History
| Date | Status | Borrower | Loan Amount |
|---|---|---|---|
| Previous Owner | Nuyda Leo C | $183,960 | |
| Previous Owner | Sound Built Homes Inc | $2,541,600 | |
| Closed | Nuyda Leo C | $45,990 |
Source: Public Records
Tax History
| Year | Tax Paid | Tax Assessment Tax Assessment Total Assessment is a certain percentage of the fair market value that is determined by local assessors to be the total taxable value of land and additions on the property. | Land | Improvement |
|---|---|---|---|---|
| 2025 | $4,213 | $460,700 | $142,100 | $318,600 |
| 2024 | $4,213 | $452,500 | $136,600 | $315,900 |
| 2023 | $4,213 | $430,200 | $116,300 | $313,900 |
| 2022 | $4,078 | $423,600 | $67,700 | $355,900 |
| 2021 | $3,663 | $341,200 | $72,800 | $268,400 |
| 2020 | $3,146 | $285,100 | $71,400 | $213,700 |
| 2019 | $2,825 | $251,000 | $57,400 | $193,600 |
| 2018 | $3,075 | $219,300 | $64,000 | $155,300 |
| 2017 | $2,827 | $209,650 | $39,350 | $170,300 |
| 2016 | $2,664 | $203,550 | $39,150 | $164,400 |
| 2014 | -- | $194,050 | $39,150 | $154,900 |
Source: Public Records
Map
Nearby Homes
- 8316 49th Loop SE
- 5428 Caleb Ct SE
- 7925 Mullen Rd SE
- 5609 Henslin Dr SE
- 7604 Brianna Ct SE
- 5025 Tri Lake Loop SE
- 4201 Arbor Ct SE
- 3901 Long Lake Dr SE
- 7349 Fair Oaks Rd SE
- 8024 68th Loop SE
- 7111 41st Ave SE
- 1176 68th Loop SE Unit 38
- 1173 68th Loop SE Unit 20
- 1180 68th Loop SE Unit 37
- 7317 Fair Oaks Rd SE
- 3727 Oakwood St SE
- 5218 Pattison Lake Ln SE
- 3300 Carpenter Rd SE Unit 107
- 3300 Carpenter Rd SE Unit 100
- 5117 Rumac St SE
- 8348 49th Loop SE
- 8404 49th Loop SE
- 8346 49th Loop SE
- 8406 49th Loop SE
- 8314 54th Ave SE
- 8310 54th Ave SE
- 8318 54th Ave SE
- 8344 49th Loop SE
- 8347 49th Loop SE
- 8306 54th Ave SE
- 8408 49th Loop SE
- 8322 54th Ave SE
- 8407 49th Loop SE
- 8302 54th Ave SE
- 8326 54th Ave SE
- 8410 49th Loop SE
- 8343 49th Loop SE
- 8411 49th Loop SE
- 8248 54th Ave SE
- 8248 54th Ave SE